

The USD/CAD currency pair is showing interesting price movements across multiple timeframes. Based on the latest technical analysis, there are significant opportunities traders can capitalize on. This article will discuss short-term, medium-term, and long-term trends while offering actionable trading advice to help you make the most of the current market conditions.
USD/CAD Analysis on H1 Timeframe
Trend
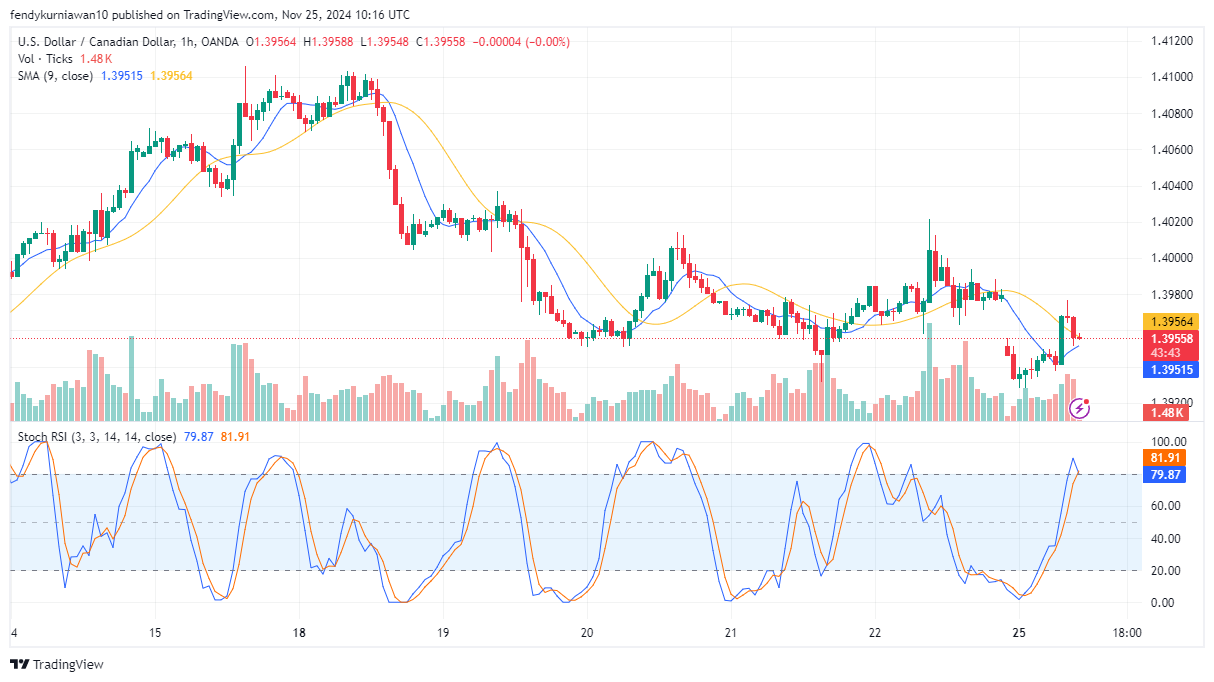
On the H1 timeframe, USD/CAD is currently in a sideways movement after correcting from its previous highs. The SMA-9 line is relatively flat, indicating a lack of dominant trend. However, trading volume is starting to increase, suggesting a potential breakout.
Support and Resistance
- Key support: 1.3920
- Key resistance: 1.3980
The price is approaching the resistance level at 1.3980, which could act as a reversal point if not broken.
Technical Indicators
- Stochastic RSI: The indicator is in the overbought zone (79.87 and 81.91), signaling potential price weakening in the short term.
- SMA-9: The price is slightly above the SMA, indicating weak bullish momentum.
H1 Conclusion: The price is likely to correct towards the 1.3920 support zone before determining its next direction.
USD/CAD Analysis on H4 Timeframe
Trend
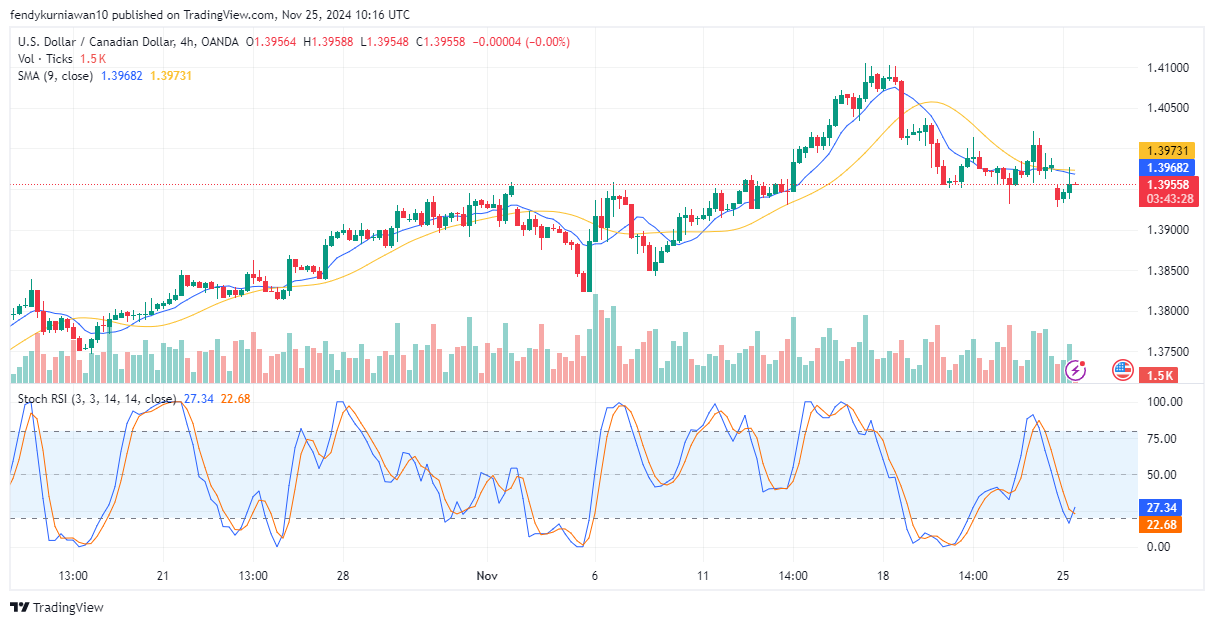
On the H4 timeframe, USD/CAD shows a mild bearish trend after failing to hold above the SMA-9 level. This trend is visible in the gradual decline supported by dominant bearish candles.
Support and Resistance
- Key support: 1.3900
- Key resistance: 1.4000
The 1.3900 level is a critical area to watch to determine if the bearish trend will continue. Meanwhile, the 1.4000 level serves as a major resistance for upward movement.
Technical Indicators
- Stochastic RSI: The indicator is in the oversold zone (27.34 and 22.68), suggesting a possible rebound soon.
- SMA-9: The price is below the SMA, indicating bearish pressure is still dominant.
H4 Conclusion: In the medium term, there is a possibility of a rebound towards 1.3970 if the 1.3900 support level holds.
USD/CAD Analysis on Daily Timeframe
Trend
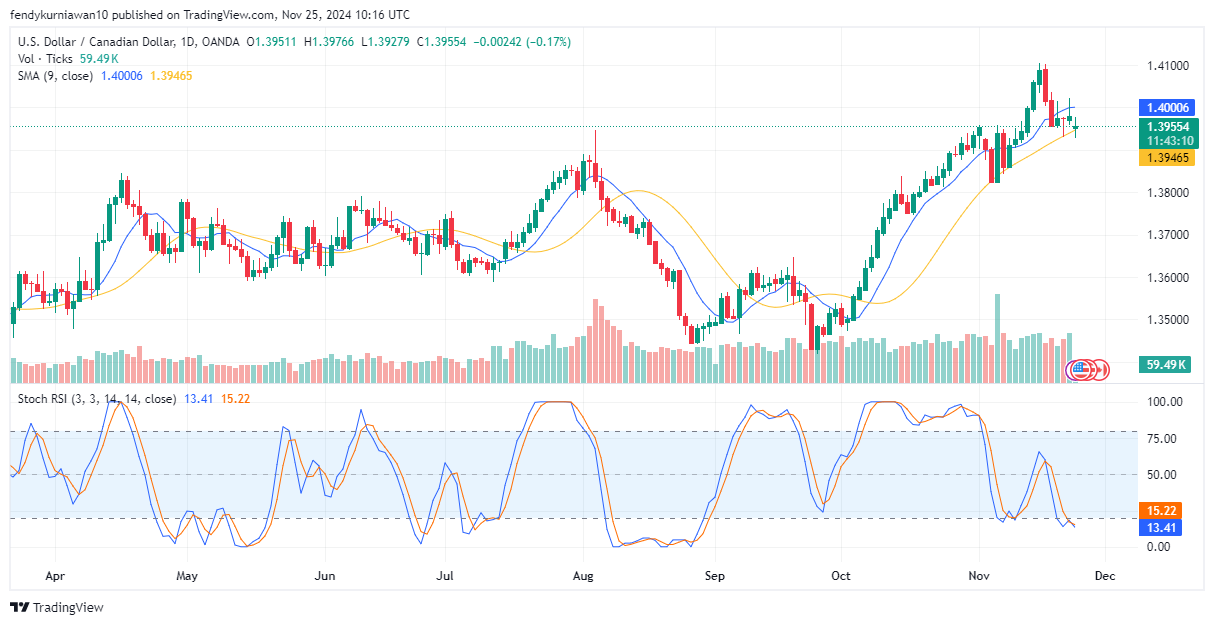
On the daily timeframe, USD/CAD remains in a long-term bullish trend, despite experiencing a healthy correction from the recent high of 1.4100. The SMA-9 line continues to act as dynamic support, sustaining the trend.
Support and Resistance
- Key support: 1.3850
- Key resistance: 1.4000
The 1.3850 level is a strong support based on previous price movements. Meanwhile, the 1.4000 level acts as a key psychological resistance.
Read: How to identify support and resistance
Technical Indicators
- Stochastic RSI: The indicator is in the oversold zone (13.41 and 15.22), providing a strong signal for a potential bullish rebound.
- SMA-9: The price is approaching the SMA, which often serves as a bouncing area for bullish trends.
Daily Conclusion: The bullish trend remains intact, with the price likely to retest the resistance at 1.4000 once the correction is complete.
USD/CAD Price Movement Predictions
- Short-term (H1): A correction towards the 1.3920 level is expected before a potential rebound.
- Medium-term (H4): A rebound towards 1.3970 is likely if the 1.3900 support level holds.
- Long-term (daily): The bullish trend remains strong, with a target resistance at 1.4000.
Trading Recommendations for USD/CAD
- Recommendation: Buy
- Entry point: 1.3920
- Take profit (TP): 1.4000
- Stop loss (SL): 1.3850
Reasons
- The Stochastic RSI on H4 and daily timeframes signals an oversold condition, often followed by a rebound.
- The 1.3920 and 1.3900 support levels are strong areas based on technical analysis.
- The long-term bullish trend on the daily timeframe supports a buy bias.
Join the TDS Community Today!
If you want to trade more effectively and safely, join the TDS Community! Our community provides the best copy trading services through the MQL5 platform. Follow selected traders for free, with no subscription fees and no need to rent a VPS. Be part of the successful traders who capitalize on the best opportunities in the forex market.
Sign up now at TDS Copytrade and start your trading journey with confidence!
![]()


