

The AUD/USD pair shows significant bearish pressure across various timeframes. In this article, we will analyze the technical conditions based on the H1, H4, and daily (D1) charts. Additionally, price movement predictions and trading suggestions will be provided to help traders make informed decisions.
AUD/USD Analysis on H1
Trend
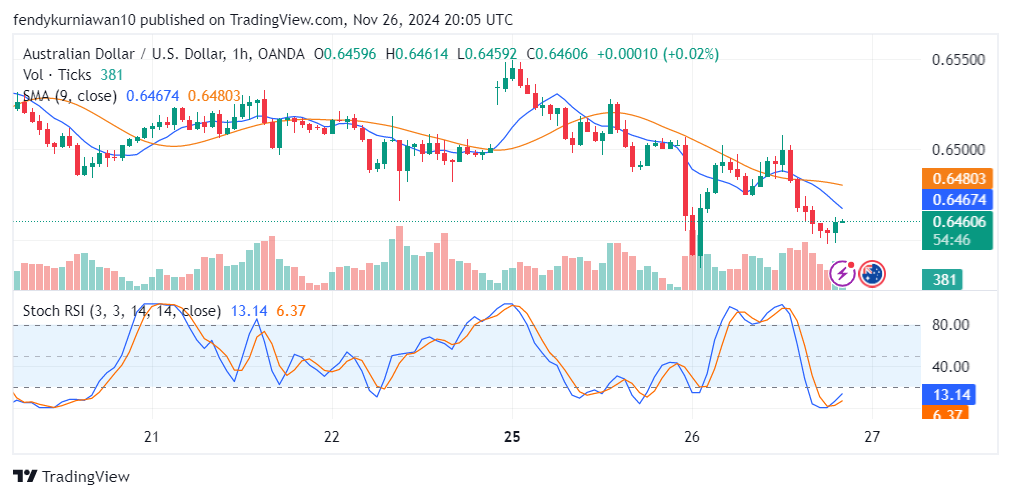
On the H1 timeframe, AUD/USD is in a strong bearish trend. The price remains below the SMA 9 and SMA 20, indicating that downward momentum is dominant. Trading volume appears relatively low, reflecting a lack of buying interest.
Support and Resistance
- Resistance: 0.6480 (SMA 9 as dynamic resistance).
- Support: 0.6460 (recent local low).
Stochastic RSI Indicator
The Stochastic RSI indicates oversold conditions, with the K% line (blue) at 13.14 and the D% line (orange) at 6.37. This signals a potential minor correction before continuing the downward trend.
AUD/USD Analysis on H4
Trend
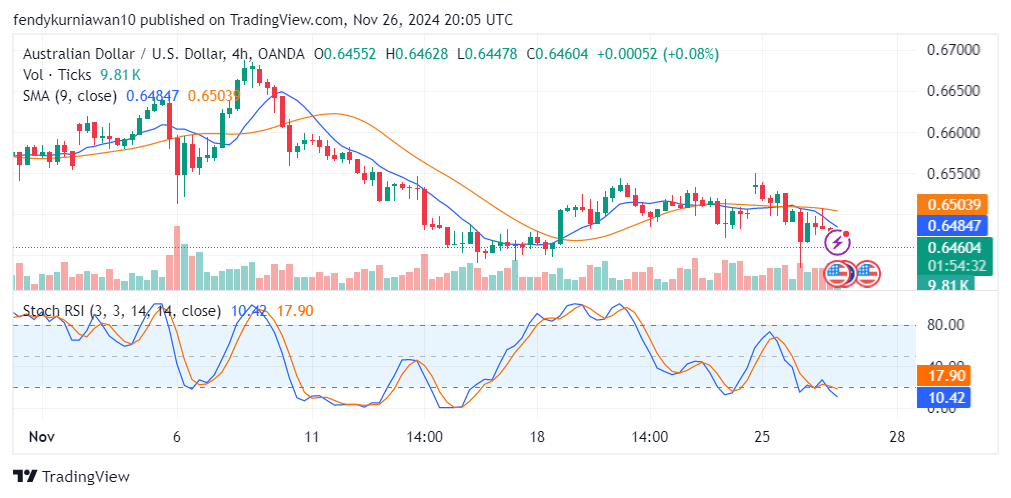
On the H4 timeframe, the bearish trend is further confirmed. Both SMA 9 and SMA 20 are sloping downward, and the price remains below these moving averages. Selling pressure appears to be increasing.
Support and Resistance
- Resistance: 0.6484 (SMA 9 as dynamic resistance).
- Support: 0.6445 (key area to watch for further declines).
Stochastic RSI Indicator
The Stochastic RSI is also in oversold territory (K%: 10.42, D%: 17.90), indicating potential for a technical correction. However, as long as the price stays below resistance, the likelihood of further declines remains high.
AUD/USD Analysis on Daily (D1)
Trend
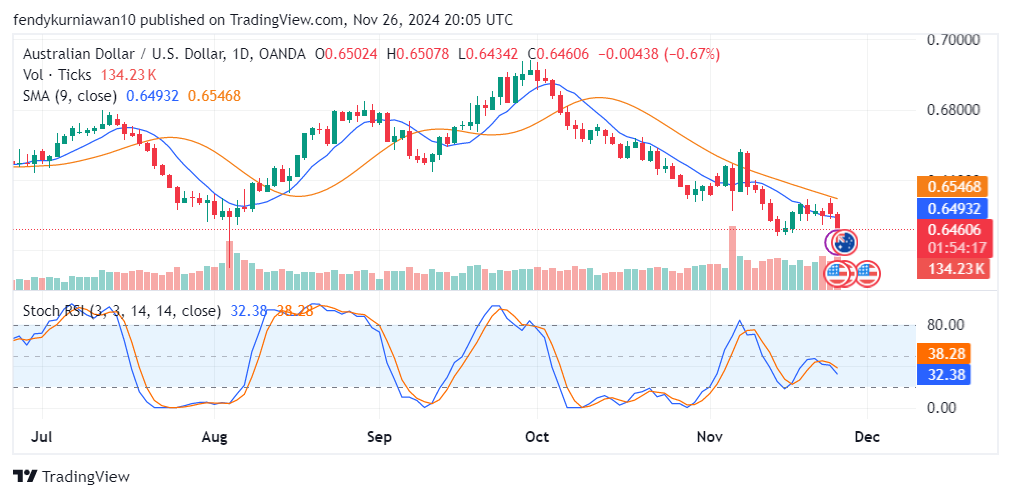
On the daily timeframe, the bearish trend is even more pronounced. AUD/USD continues to form lower highs and lower lows. The SMA 9 and SMA 20 remain above the price, confirming sustained selling pressure.
Support and Resistance
- Resistance: 0.6546 (SMA 9 and a strong psychological level).
- Support: 0.6400 (critical level to watch for long-term downside movement).
Read: How to identify support and resistance
Stochastic RSI Indicator
The Stochastic RSI on the daily timeframe indicates weakening momentum near oversold levels (K%: 32.38, D%: 38.28). However, no clear reversal signal has emerged yet.
AUD/USD Forecast
Based on analysis across the three timeframes:
- Short-term: AUD/USD is likely to see a minor correction toward the nearest resistance (0.6480 on H1).
- Medium-term: Further declines are expected if the price fails to break above 0.6484 (H4).
- Long-term: The price could test the 0.6400 support level if the bearish trend continues on the daily chart.
Trading Suggestions
Based on the technical analysis, here are the trading recommendations for AUD/USD:
- Recommendation: Sell.
- Entry point: 0.6470 (near dynamic resistance on H4).
- Take profit (TP): 0.6445 (H4 support) or 0.6400 (daily support).
- Stop loss (SL): 0.6500 (above H4 resistance).
Reasons:
- The price is in a bearish trend across all timeframes.
- The Stochastic RSI suggests a minor correction, but the overall trend remains downward.
- Strong resistance at the 0.6480–0.6500 area provides a good selling opportunity.
Join TDS Community Today!
Want to trade more effectively and securely? Join TDS Community, a forex trading community that provides copy trading services from top traders on MQL5. Enjoy free copy trading with no subscription fees and no VPS rental costs.
Benefits of joining:
- Copy trading from experienced traders.
- Accurate daily technical analyses.
- Trading education for beginners and professionals.
Sign up now at tdscopytrade.com and trade safely with our community!
![]()


