

The AUD/USD pair has shown interesting dynamics over the past few days, with price action reflecting bearish pressure but also offering rebound opportunities. This article will analyze AUD/USD based on 1-hour (H1), 4-hour (H4), and daily timeframes. We will also provide price movement predictions, trading strategies, and actionable entry recommendations.
AUD/USD Daily Analysis
Trend
On the daily timeframe, AUD/USD is in a strong downtrend, which has persisted since early October. Prices continue to trade below the 9-period SMA, indicating seller dominance. However, recent sessions suggest buyers are attempting to hold the decline around the 0.6490 support level.
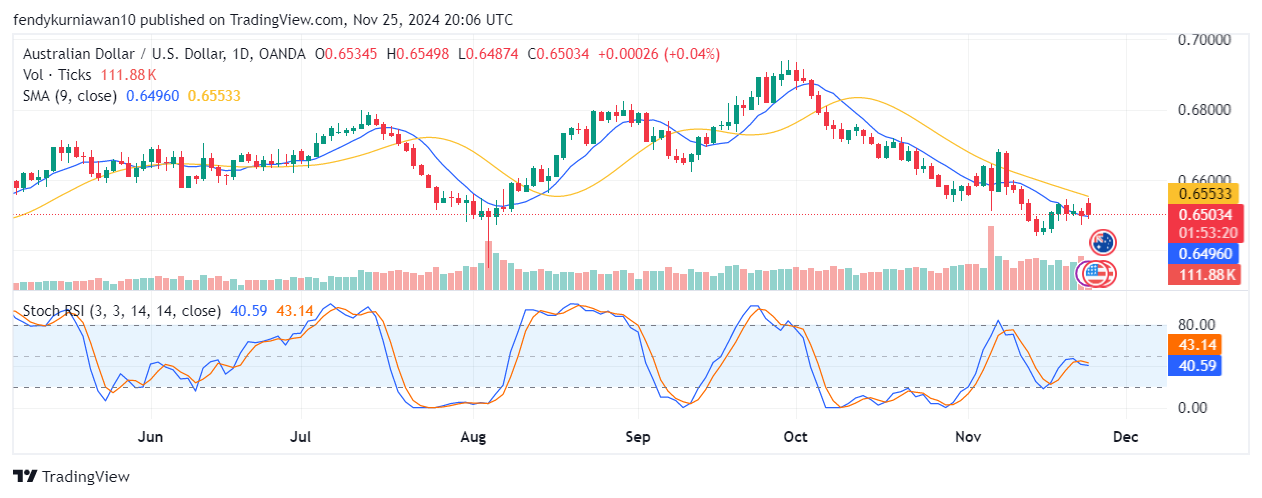
Support and Resistance
- Key support: 0.6490 (recent low area)
- Immediate resistance: 0.6553 (9-period SMA)
- Next resistance: 0.6630 (previous psychological level)
Technical Indicators
- Stochastic RSI: Indicates potential reversal from the oversold zone. The %K line has crossed above the %D line, providing an early bullish signal.
- Volume: Relatively steady but has not yet shown a significant spike to confirm a major momentum shift.
AUD/USD H4 Analysis
Trend
On the H4 timeframe, AUD/USD shows consolidation after previously facing bearish pressure. The SMA 9 and SMA 50 have formed a bearish crossover pattern. However, the price is attempting to approach the SMA 9 level, signaling potential retracement.
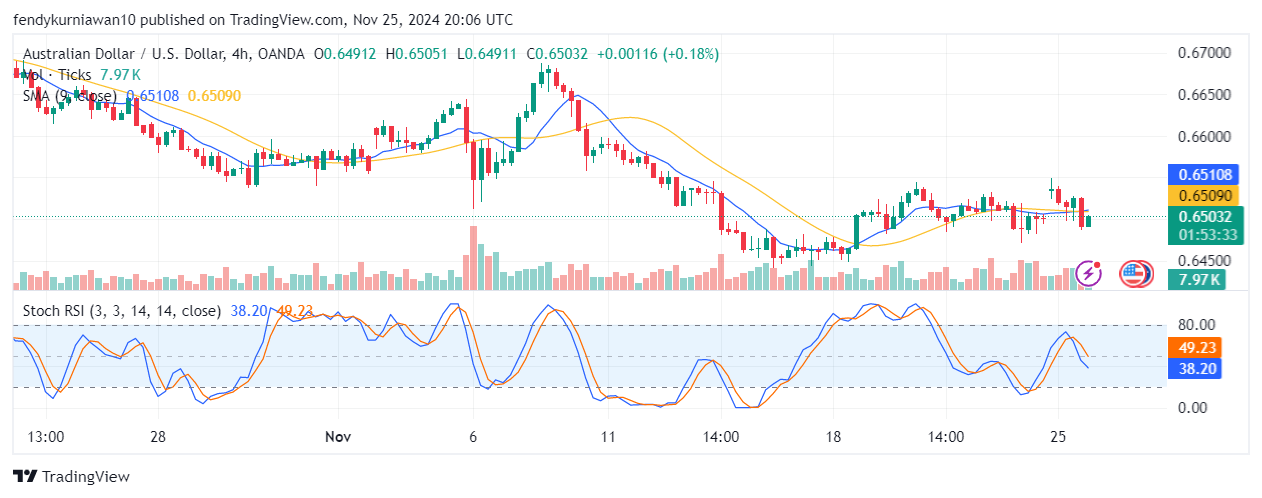
Support and Resistance
- Key support: 0.6490 (confirmed in previous candles)
- Immediate resistance: 0.6510 (SMA 9)
- Major resistance: 0.6560 (previous consolidation area)
Technical Indicators
- Stochastic RSI: Currently in a neutral zone but shows potential for crossing downward, signaling weakening momentum if the price fails to break above the SMA 9.
- Volume: Relatively low, indicating a lack of momentum for a decisive breakout.
AUD/USD H1 Analysis
Trend
On the H1 timeframe, AUD/USD exhibits a sideways movement, with prices fluctuating between the 0.6490 support and 0.6510 resistance levels. The most recent candle shows a long wick at the bottom, signaling buying pressure at the support level.
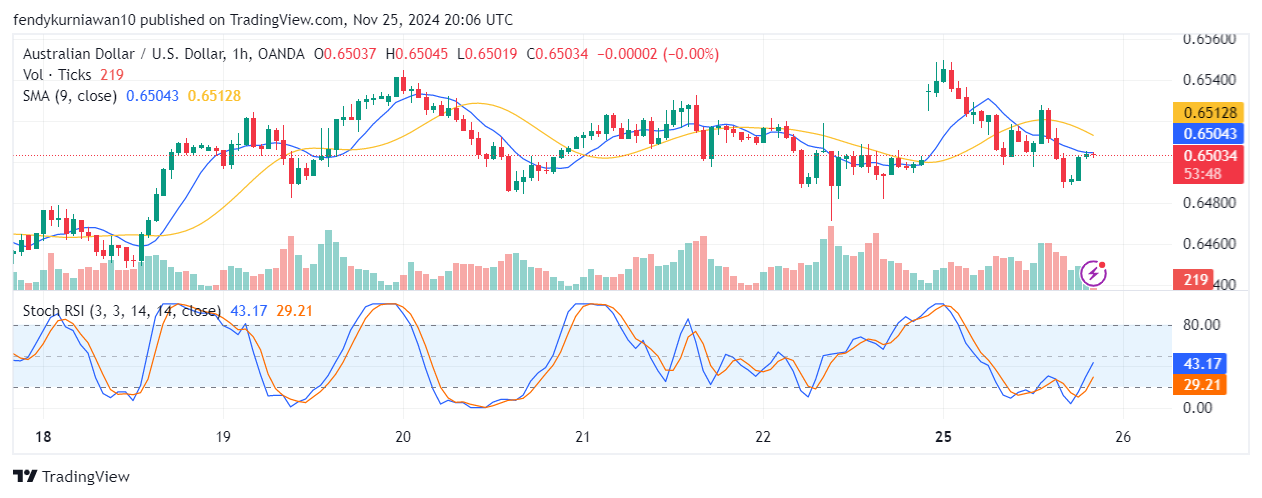
Support and Resistance
- Support: 0.6490
- Resistance: 0.6510 (SMA 9 acting as immediate resistance)
- Next target resistance: 0.6535
Read: How to identify support and resistance
Technical Indicators
- Stochastic RSI: Turning upward from the oversold zone, providing a weak bullish signal.
- Volume: Low, indicating that the price lacks sufficient momentum to break out.
AUD/USD Price Movement Predictions
Based on technical analysis across multiple timeframes:
- Short term: AUD/USD is likely to rebound toward the 0.6530 resistance level if it holds above the 0.6490 support.
- Medium term: Price is expected to move sideways until a breakout above 0.6560 resistance or a breakdown below 0.6490 support occurs.
- Long term: The bearish trend remains dominant, but potential reversals could emerge if buyers regain control above 0.6630.
Trading Recommendations
Based on the above analysis, here is the recommended trading strategy:
- Buy Entry:
- Entry Point: 0.6495 (near the support level)
- Take Profit (TP): 0.6535
- Stop Loss (SL): 0.6475
- Reasoning:
The 0.6490 level serves as a strong support that has been tested multiple times. The Stochastic RSI indicates oversold conditions, supporting short-term rebound opportunities.
Join the TDS Community Today!
TDS Community is the best trading community offering free copy trading services. You can follow the best traders on MQL5 without subscription fees or VPS rental costs. By joining, you’ll gain access to in-depth analysis, trading signals, and a supportive community to help you grow as a professional trader.
![]()


