

The EUR/USD currency pair shows an interesting price movement across multiple timeframes, providing traders with opportunities to make informed decisions based on technical analysis. In this article, we will explore short- to long-term trends, support and resistance levels, and provide actionable trading recommendations.
EUR/USD Analysis on 1-Hour Timeframe (H1)
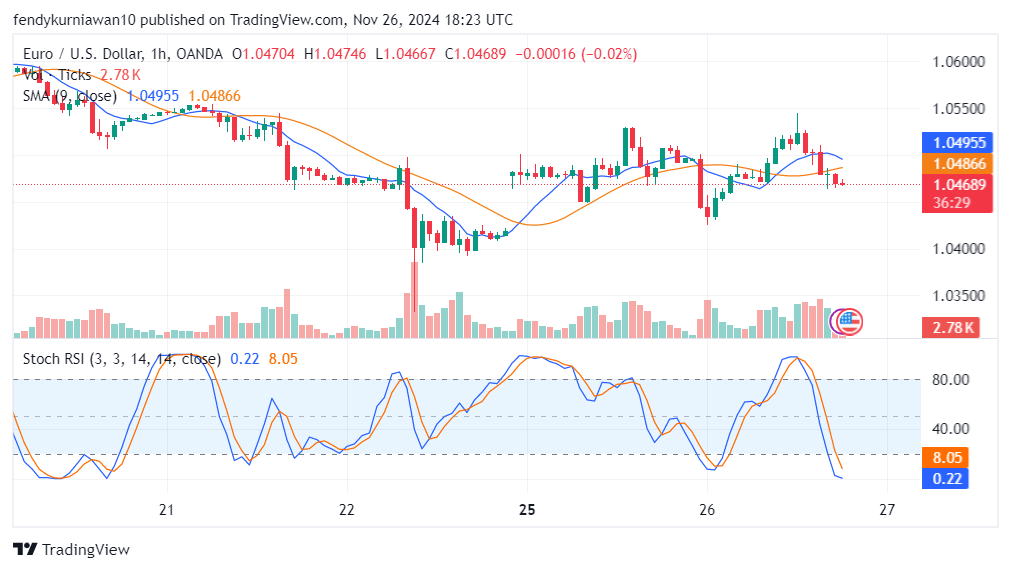
On the 1-hour timeframe, EUR/USD exhibits a sideways pattern with bearish pressure dominating the later session.
Trend
- The price is moving below the 9-period SMA, indicating continued selling pressure.
- There is no significant momentum for an uptrend, suggesting consolidation at lower levels.
Support and Resistance
- Support: The 1.0460 level serves as the primary support.
- Resistance: The 1.0495 level is the nearest resistance and needs to be broken for an upward move.
Technical Indicators
- Stochastic RSI: The Stochastic RSI is in the oversold area (below 20), indicating potential for a short-term rebound. However, no strong bullish confirmation has appeared yet.
H1 Summary: EUR/USD is likely to consolidate within a narrow range, with a dominant bearish bias.
EUR/USD Analysis on 4-Hour Timeframe (H4)
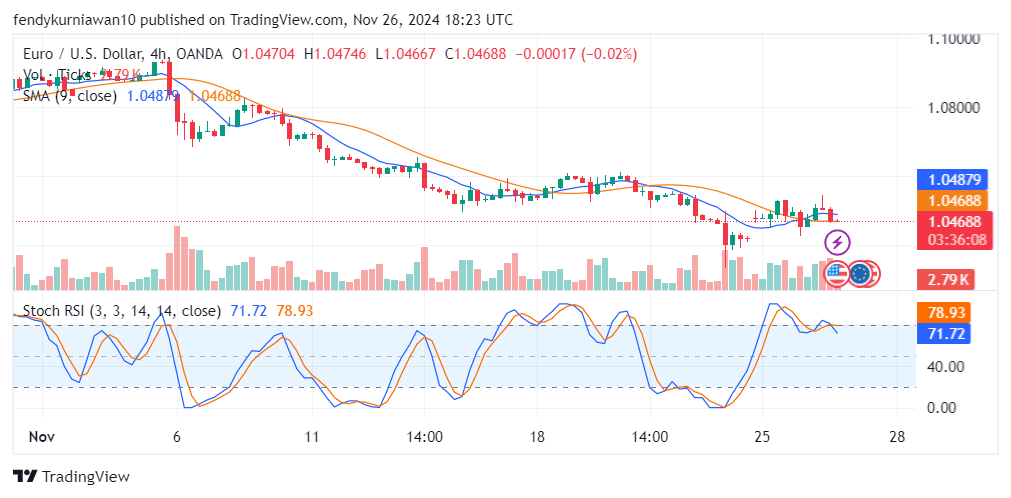
On the 4-hour timeframe, the bearish momentum is more evident, though early signs of consolidation are emerging.
Trend
- The price remains below the 9-period SMA, reinforcing consistent bearish momentum.
- The previous downtrend is slowing, indicating potential consolidation before the next directional move.
Support and Resistance
- Support: The 1.0460 level remains a critical area to watch.
- Resistance: The 1.0488 level acts as significant short-term resistance.
Technical Indicators
- Stochastic RSI: The indicator is approaching overbought levels following a recent rebound. This suggests that selling pressure may return.
H4 Summary: EUR/USD is in a consolidation phase but remains vulnerable to further bearish moves if resistance is not broken.
EUR/USD Analysis on Daily Timeframe (D1)
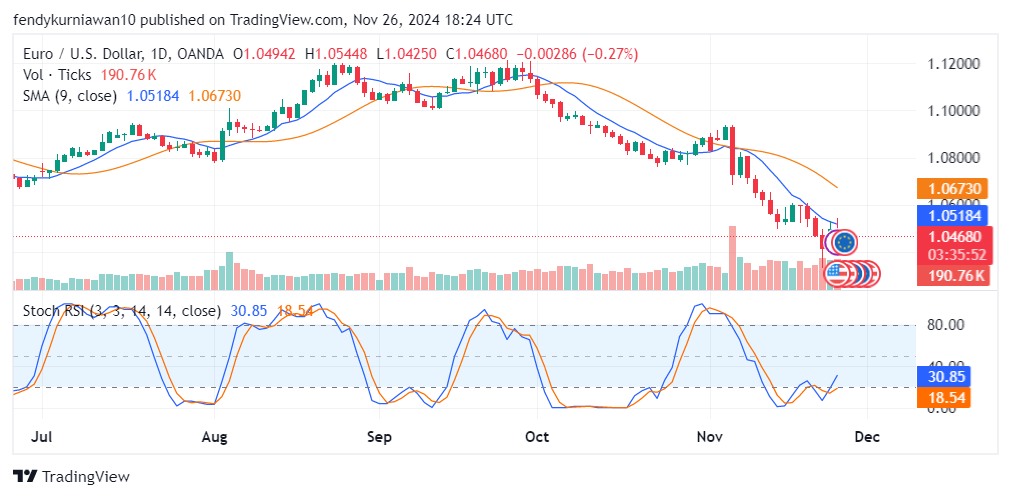
On the daily timeframe, EUR/USD continues to exhibit a strong downtrend, with the price staying below the 9-period SMA, reflecting sustained bearish pressure.
Trend
- The price continues to decline after failing to break the key resistance at 1.0670.
- The downtrend remains dominant, with no significant reversal signals yet.
Support and Resistance
- Support: The 1.0460 level is a crucial support zone.
- Resistance: The nearest resistance is at 1.0518, followed by the psychological level of 1.0670.
Read: How to identify support and resistance
Technical Indicators
- Stochastic RSI: The indicator is in the oversold area but has not yet formed a bullish crossover, suggesting further downside potential.
D1 Summary: The strong downtrend persists, with EUR/USD under significant selling pressure.
EUR/USD Price Movement Prediction
- Short-Term (1-2 days): The price is expected to remain within a consolidation range near the 1.0460 support level, with a slight risk of correction toward 1.0488.
- Long-Term (1 week or more): The downtrend is likely to continue if the 1.0460 level is breached, with a potential target near 1.0400.
EUR/USD Trading Recommendations
Sell Strategy
- Entry Point: 1.0480 (wait for a pullback to resistance).
- Take Profit (TP): 1.0435 (near the next support level).
- Stop Loss (SL): 1.0510 (above significant resistance).
Reasoning:
- The price is under bearish pressure across all timeframes.
- The 9-period SMA confirms selling dominance, while the Stochastic RSI indicates potential for further downside after overbought conditions on H4.
Buy Strategy (Alternative for a Breakout)
- Entry Point: 1.0518 (after confirmed breakout on D1).
- Take Profit (TP): 1.0570.
- Stop Loss (SL): 1.0490.
Reasoning:
- A breakout above the 1.0518 resistance may trigger a short-term bullish correction.
Call to Action
Want to trade with more effective and secure strategies? Join TDS Community today! We offer copy trading from the best traders on MQL5 for free, with no subscription fees and no VPS rental costs. With TDS Community, you can trade safely and confidently.
![]()


