
The GBP/USD pair continues to exhibit significant bearish pressure across all timeframes, from short-term to long-term. The downtrend is supported by technical indicators and price structure, reinforcing the bearish momentum. This article provides a technical analysis based on H4, Daily, and Weekly timeframes to help you understand market conditions and trading opportunities.
GBP/USD Analysis on H4
Trend
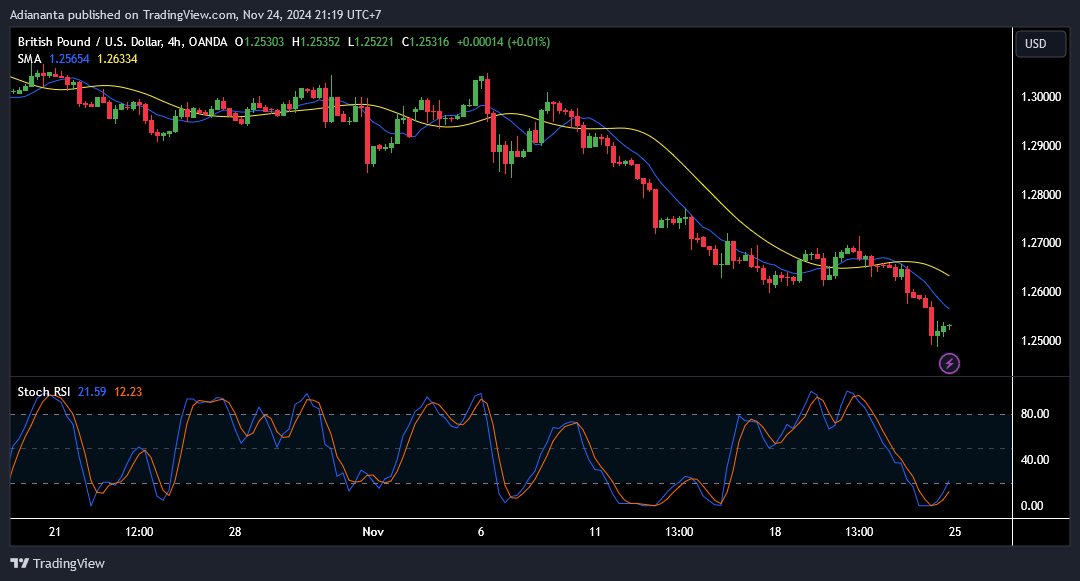
In the H4 timeframe, GBP/USD is in a clear downtrend. The price remains below the 50 and 100 SMAs, confirming strong seller dominance in the market.
Support and Resistance
- Key Support: 1.2500
- Nearest Resistance: 1.2560
Stoch RSI Indicator
- Overbought/Oversold: The Stoch RSI is in an oversold position (21.59), suggesting a potential minor rebound, but bearish dominance persists.
Read more: Technical Analysis of EUR/USD This Week: Bearish Potential!
GBP/USD Analysis on Daily
Trend
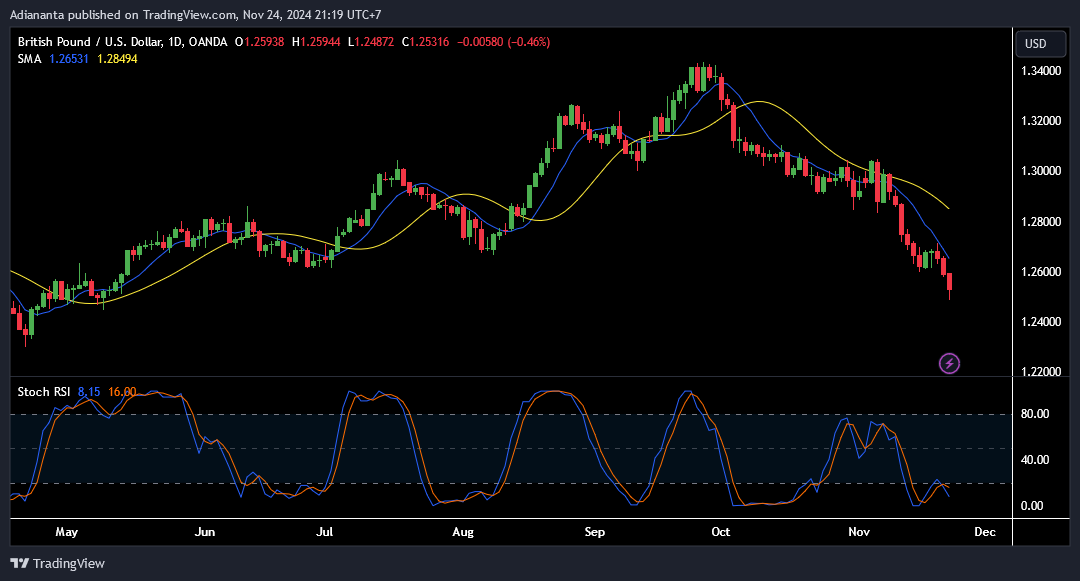
In the Daily timeframe, GBP/USD displays a medium-term bearish trend. The price has crossed below the 50 SMA (1.2849) and continues to move away from it, indicating increasing selling pressure.
Support and Resistance
- Key Support: 1.2450
- Key Resistance: 1.2650
Stoch RSI Indicator
- Overbought/Oversold: The Stoch RSI is at an extreme oversold level (8.15), suggesting a minor price correction may occur before further declines.
GBP/USD Analysis on Weekly
Trend
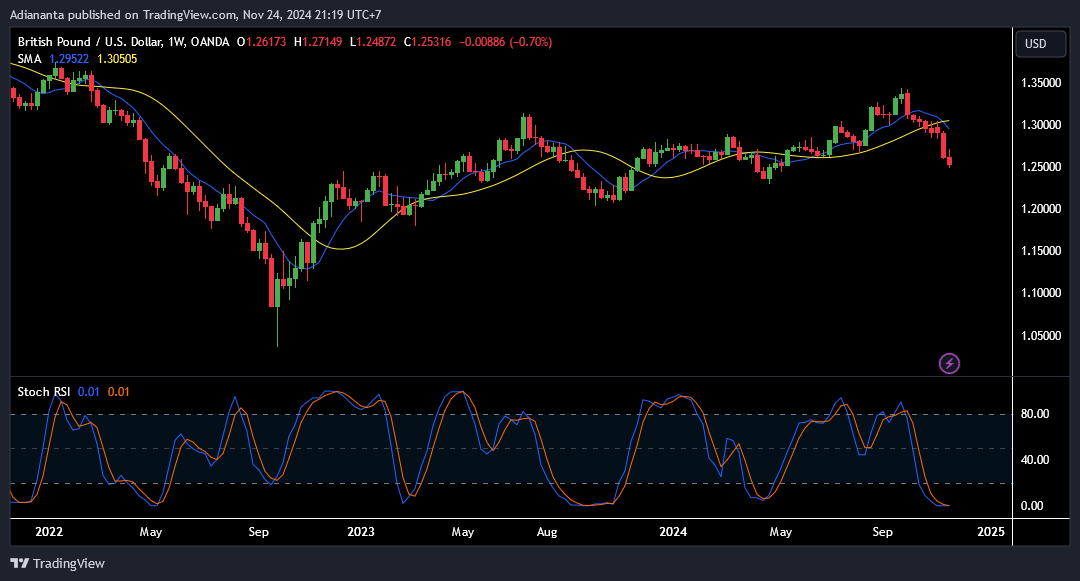
In the Weekly timeframe, GBP/USD demonstrates a long-term bearish trend. The price has crossed below the 50 SMA and is heading toward the main support level, reinforcing consistent selling pressure.
Support and Resistance
- Key Support: 1.2400
- Key Resistance: 1.2800
Stoch RSI Indicator
- Overbought/Oversold: The Stoch RSI is at an extreme oversold level (0.01), indicating potential consolidation before the price resumes its downward movement.
Read more: Risk Management in Forex Trading
Price Movement Predictions
Short-Term (H4 – Daily)
The price is likely to test resistance levels at 1.2560-1.2650 before continuing its decline toward the support area of 1.2450-1.2400.
Long-Term (Weekly)
GBP/USD is expected to move toward the 1.2400 support level. If this level breaks, the next target will be around 1.2300.
Trading Recommendations
- Position: Sell
- Entry Point: 1.2560 (if the price pulls back)
- Take Profit (TP): 1.2450
- Stop Loss (SL): 1.2650
Reasons:
- Strong bearish trend visible across all timeframes.
- Oversold Stoch RSI indicates potential for minor correction, but no significant reversal signal yet.
- The 1.2560 resistance level offers an ideal risk-reward ratio for entry.
With this in-depth analysis, you can take advantage of GBP/USD trading opportunities this week. Always practice proper risk management and monitor the market regularly to ensure well-informed trading decisions!
Join the TDS Community!
Looking for more trading opportunities like this? Join the TDS Community today! We offer a free copy trading service with no subscription fees and no VPS costs. With TDS Community, you can replicate strategies from the best traders on MQL5 to enhance your trading journey safely and efficiently. Click join button below and start trading with confidence today!
![]()


