

The GBP/USD pair is showing consistent bearish movement across multiple timeframes. Using technical indicators like Bollinger Bands and Stochastic RSI, we can uncover the market dynamics. This article provides a detailed analysis for each timeframe, price movement predictions, and actionable trading suggestions.
GBP/USD 1-Hour Analysis (1H)
Trend
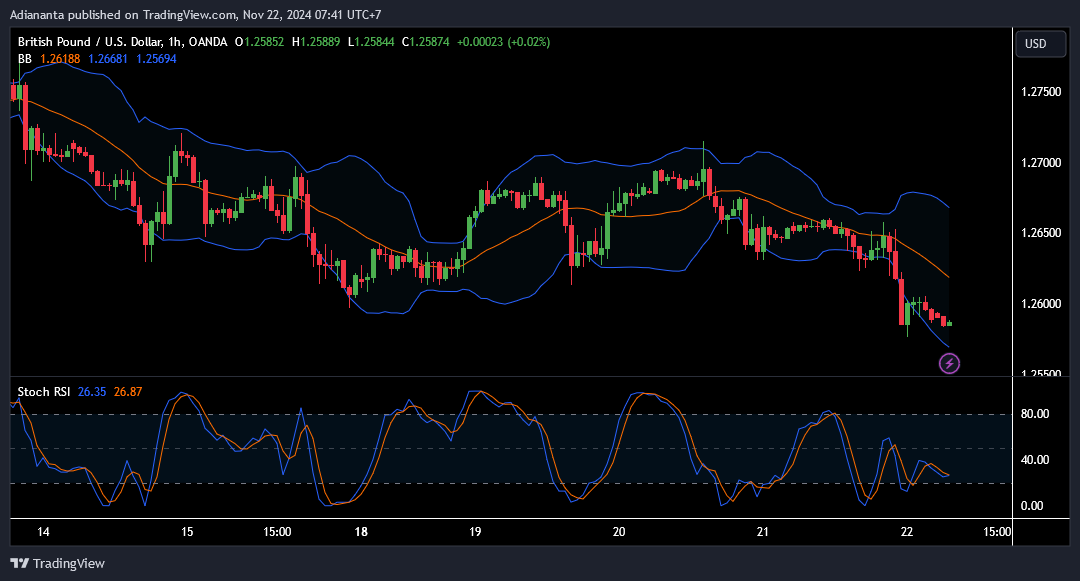
On the 1-hour (1H) timeframe, GBP/USD is in a downtrend, as price trades below the middle line of the Bollinger Bands. This indicates strong selling pressure in the short term.
Support and Resistance
- Key Resistance: 1.26188 (upper Bollinger Band).
- Strong Support: 1.25694 (lower Bollinger Band).
Technical Indicators
- Bollinger Bands: Price is near or touching the lower band, signaling a potential oversold condition.
- Stochastic RSI: At 26, indicating oversold momentum is not yet exhausted.
Conclusion: In the short term, GBP/USD is likely to remain bearish, with slight corrective potential.
Read: XAU/USD Technical Analysis Today: Bullish!
GBP/USD 4-Hour Analysis (4H)
Trend
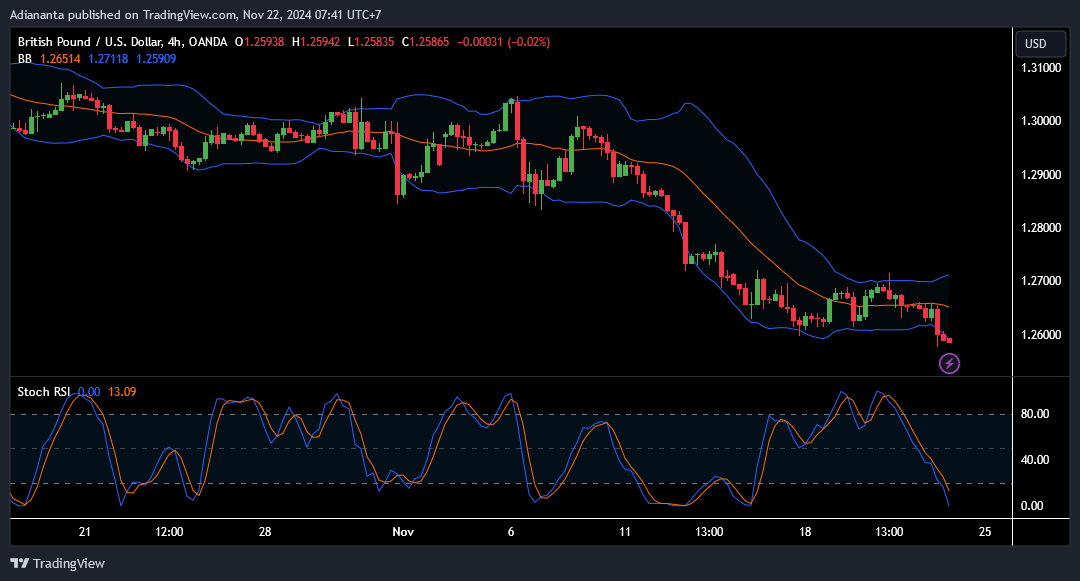
On the 4-hour (4H) timeframe, GBP/USD also shows a strong bearish trend, with the price repeatedly breaking new support levels, highlighting dominant selling pressure.
Support and Resistance
- Key Resistance: 1.27118 (upper Bollinger Band).
- Strong Support: 1.25909 (lower Bollinger Band).
Technical Indicators
- Bollinger Bands: Price is close to the lower band, signaling potential oversold conditions.
- Stochastic RSI: At 13, suggesting extreme bearish momentum with no signs of reversal yet.
Conclusion: GBP/USD is expected to decline further on this timeframe.
Read: EUR/USD Technical Analysis Today: Bearish!
GBP/USD Daily Analysis (1D)
Trend
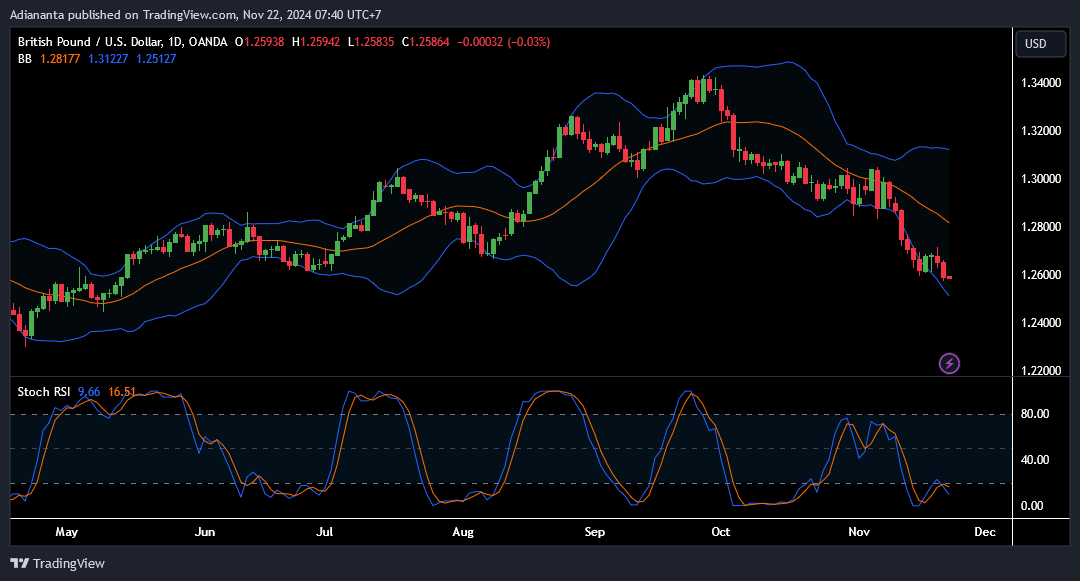
On the daily (1D) timeframe, GBP/USD shows a long-term bearish trend, as seen by the consistent formation of lower highs and lower lows.
Support and Resistance
- Key Resistance: 1.31227 (upper Bollinger Band).
- Strong Support: 1.25127 (lower Bollinger Band).
Technical Indicators
- Bollinger Bands: Price is approaching the lower band.
- Stochastic RSI: At 9, signaling extreme oversold conditions with the potential for a long-term reversal.
Conclusion: The pair is under significant selling pressure but may experience a minor correction in the coming days.
Read: How to identify support and resistance
GBP/USD Price Movement Predictions
Based on the analysis:
- Short-term (1H): The price is expected to weaken further, targeting 1.25500.
- Medium-term (4H): The price may drop to the support level of 1.25000.
- Long-term (1D): A correction towards 1.27000 may occur before continuing the bearish trend.
Trading Suggestions
- Recommendation: Sell
- Entry Point: 1.25800
- Take Profit (TP): 1.25000
- Stop Loss (SL): 1.26500
Rationale: The dominant bearish trend across all timeframes is supported by technical indicators (Stochastic RSI in oversold territory and price below the middle Bollinger Band). While minor corrections are possible, selling pressure remains strong.
Join TDS CopyTrade Now!
Want to trade safely while following the strategies of the best traders? Join the TDS Community today! We offer free copy trading via the MQL5 platform with no subscription or VPS fees. Gain access to top strategies and take your trading to the next level. Click button below here and start your trading journey now!
![]()


