
Understanding how to identify support and resistance levels is critical for any forex trader. Whether you’re just starting out or aiming to refine your strategies, these key levels play a pivotal role in predicting market behavior. But what are they, and how can you spot them? This guide will help you confidently navigate these essential concepts.
What are support and resistance levels?
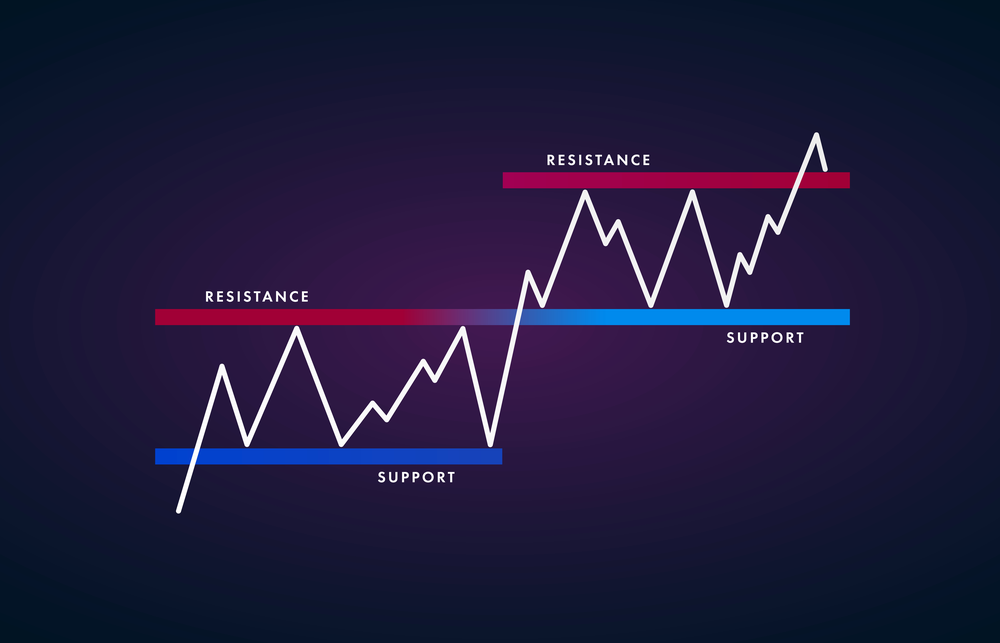
Support and resistance levels reflect price points where the market often reacts. Support is a price level where a downtrend can be expected to pause due to a concentration of buying interest. In contrast, resistance represents a price level where a trend higher may pause due to selling pressure. Think of support as the floor holding prices up and resistance as the ceiling capping prices.
Why are these levels so important?
Forex trading heavily relies on market movements, and support and resistance levels can indicate future trends. These levels are psychological triggers for traders around the world. For example, a break above a resistance level may suggest an uptrend, while a bounce off a support level indicates strength.
Read: How to Use the Moving Average Indicator
How to identify support and resistance levels
So, how can you spot these levels effectively? Here are a few steps to help you get started:
- Examine historical price charts
The most straightforward way to spot support and resistance is by looking at historical price charts. Look for areas where prices have struggled to move beyond or fallen below. These points often mark key support or resistance levels. - Use trendlines
Drawing trendlines on your price chart can reveal potential support and resistance. A trendline connecting multiple low points can form a rising support line, while one connecting highs can form a resistance line. - Moving averages
Moving averages can act as dynamic support and resistance. When a price dips near a moving average line, it can serve as temporary support or resistance. This method is especially popular in copy trading strategies to maintain consistent profits. - Fibonacci retracement
Many forex traders use Fibonacci retracement tools to predict support and resistance levels. By measuring the peak-to-trough move of a trend, you can identify retracement levels that are likely to act as resistance or support in future moves.
Practical examples of support and resistance
When trading forex with broker XM, many traders rely on visual chart patterns to identify support and resistance. For instance, assume a currency pair has consistently bounced off a level like 1.2000. This point becomes a strong support level. Conversely, if it struggles to break through 1.3000, you’ve identified a resistance level.
Key indicators for confirming support and resistance levels
To increase the reliability of your analysis, consider using indicators like:
- Relative Strength Index (RSI): When RSI approaches overbought or oversold levels, the price often reacts around established support or resistance points.
- Bollinger Bands: These bands reflect price volatility and can act as flexible support or resistance zones.
- Volume analysis: Higher volume near support or resistance can strengthen the significance of these levels.
How to use support and resistance in your trading strategy
Understanding how to use these levels can improve your chances of successful trades. Here are some approaches:
- Breakout strategy
When a price breaks above resistance or below support, it often signals a significant move. A breakout could indicate an opportunity to enter the market. - Reversal strategy
If a price fails to break through a level and reverses direction, it signals potential market strength or weakness.
Read: Fundamental vs Technical Analysis in Forex Trading
Tips for beginners on using support and resistance
- Start with daily charts
Begin your analysis using longer timeframes like daily charts. These often reveal more robust support and resistance levels. - Be aware of false breakouts
Not every move past support or resistance is genuine. Use volume analysis to confirm breakouts. - Incorporate copy trading strategies
By observing experienced traders, you can see how they apply support and resistance levels in real-world scenarios. The TDS Community offers numerous insights for safe and secure trading practices.
Common mistakes to avoid
- Over-relying on support and resistance
While these levels are useful, they are not guaranteed. Combining them with other indicators can boost accuracy. - Ignoring market context
Support and resistance levels can shift with changing market trends and sentiment.
Conclusion
Mastering support and resistance levels is a journey every forex trader must take. By understanding these concepts, you can refine your strategy, protect your trades, and make informed decisions. Whether you trade with broker XM or are a member of the TDS Community, these skills are essential for safe trading success.
![]()


