

Introduction
Today, the NZD/USD pair shows an interesting price movement across different timeframes. From lower to higher timeframes, there is a potential price reversal that traders can take advantage of. This analysis will detail the price action of NZD/USD on the H1, H4, and Daily timeframes. Additionally, we’ll provide price movement predictions and relevant trading suggestions.
NZD/USD H1 Analysis
Trend
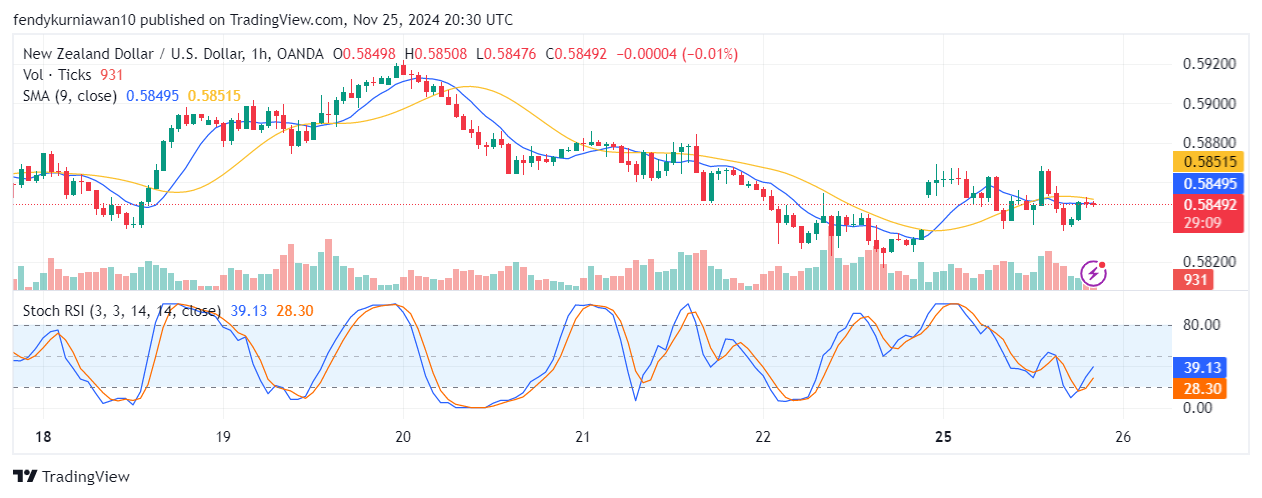
On the H1 timeframe, NZD/USD is moving in a sideways trend with a slight bearish bias. The 9-period SMA (Simple Moving Average) shows that the price is currently below the average, indicating short-term selling pressure.
Support and resistance
- Resistance: 0.5855
- Support: 0.5840
The price is currently hovering near a strong support level. If a breakout occurs below 0.5840, further bearish momentum could unfold. Conversely, if the price breaks above the 0.5855 resistance, the potential for a bullish move increases.
Technical indicators
- Stochastic RSI: The Stochastic RSI indicates an oversold condition with %K (39.13) near %D (28.30). This suggests a potential price rebound in the short term.
NZD/USD H4 Analysis
Trend
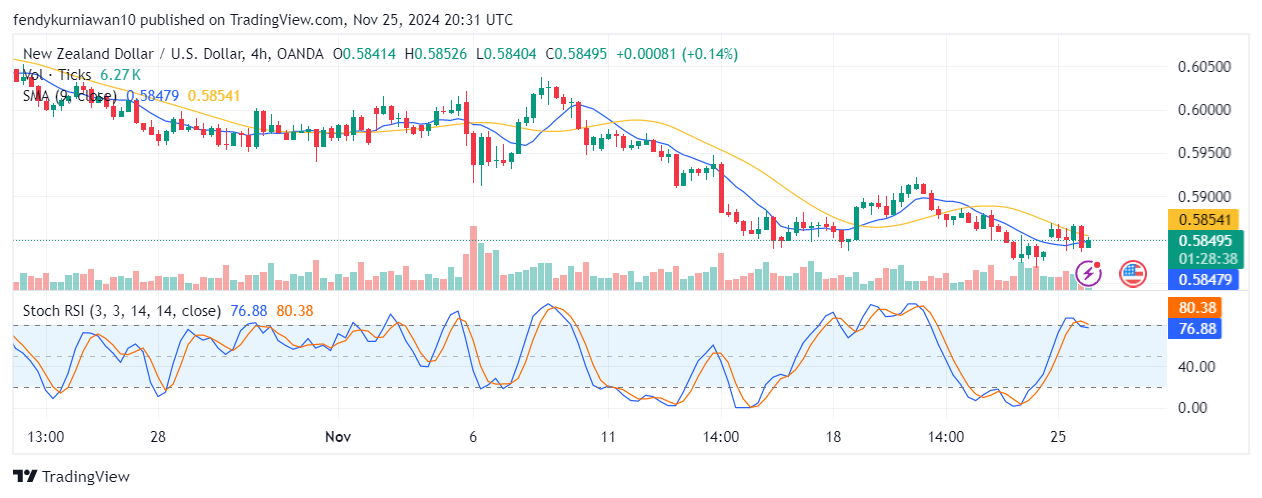
The H4 timeframe shows a more distinct downtrend, with the price consistently below the 9-period SMA. This trend signals dominant selling pressure in the medium term.
Support and resistance
- Resistance: 0.5880
- Support: 0.5830
The support level at 0.5830 is a critical zone to watch. If this level is breached, the bearish trend is likely to continue toward lower price levels.
Technical indicators
- Stochastic RSI: The indicator signals an overbought condition, with %K (76.88) above %D (80.38). This suggests a potential bearish correction in the near term.
NZD/USD Daily Analysis
Trend
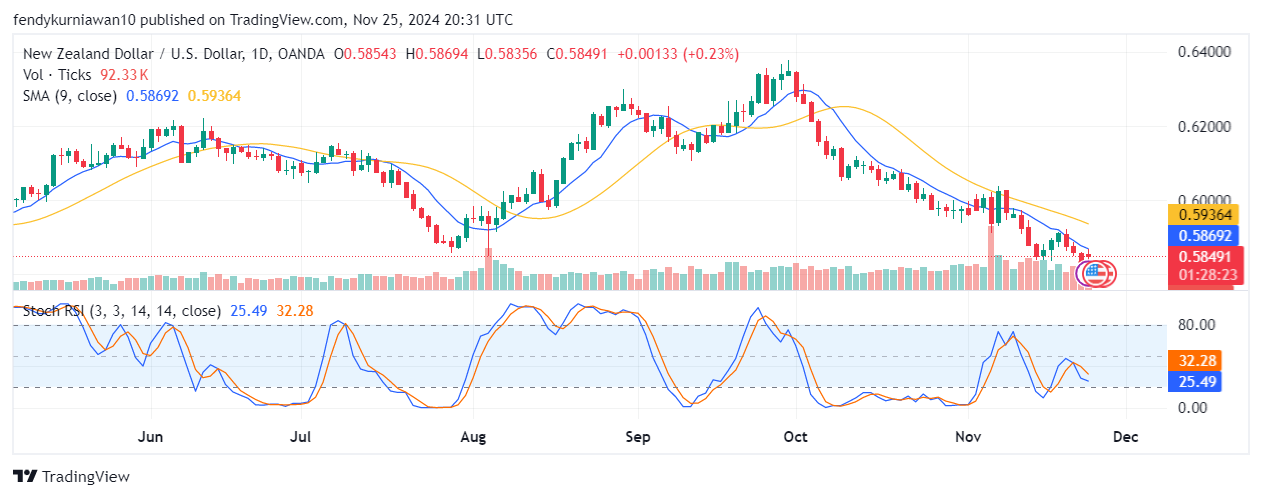
On the Daily timeframe, the pair maintains a strong downtrend, as evidenced by the price consistently below the 9-period SMA. The formation of consecutive lower highs and lower lows underscores the selling pressure.
Support and resistance
- Resistance: 0.5935
- Support: 0.5800
The support level at 0.5800 is a crucial area to hold the trend. If this level is broken, the bearish movement toward 0.5750 becomes more probable.
Read: How to identify support and resistance
Technical indicators
- Stochastic RSI: The Stochastic RSI indicates an oversold condition, with %K (32.28) and %D (25.49). This suggests a potential price rebound in the near future.
NZD/USD Price Movement Prediction
Based on the analysis across all timeframes:
- Short-term (H1): Limited bullish potential toward the 0.5855 resistance.
- Medium-term (H4): Bearish correction toward the 0.5830 support before a potential rebound.
- Long-term (Daily): Downtrend remains dominant, but a rebound toward 0.5900 is possible if the oversold condition materializes.
NZD/USD Trading Recommendations
Based on technical analysis, here is the trading suggestion:
- Entry: Buy near 0.5840 (close to strong support).
- Take Profit (TP): 0.5880 (H4 resistance).
- Stop Loss (SL): 0.5820 (slightly below Daily support).
Reasoning: The oversold condition on the Daily and H1 timeframes provides an opportunity for a temporary rebound. However, the 9-period SMA on the Daily suggests caution as selling pressure remains.
Call to Action
Want to receive detailed technical analysis like this regularly? Join TDS Community, a forex trading community that provides free copy trading services without subscription or VPS costs! Enjoy trading opportunities with top traders on the MQL5 platform and achieve consistent profits with us.
![]()


