Introduction
The EUR/USD currency pair shows volatility across different timeframes with mixed trends that attract forex traders’ attention. The technical data on the charts indicate a possibility for the pair to move higher, but bearish pressure persists. Let’s analyze each timeframe in detail to provide a forecast for the EUR/USD price movement.
EUR/USD Daily Analysis
Trend
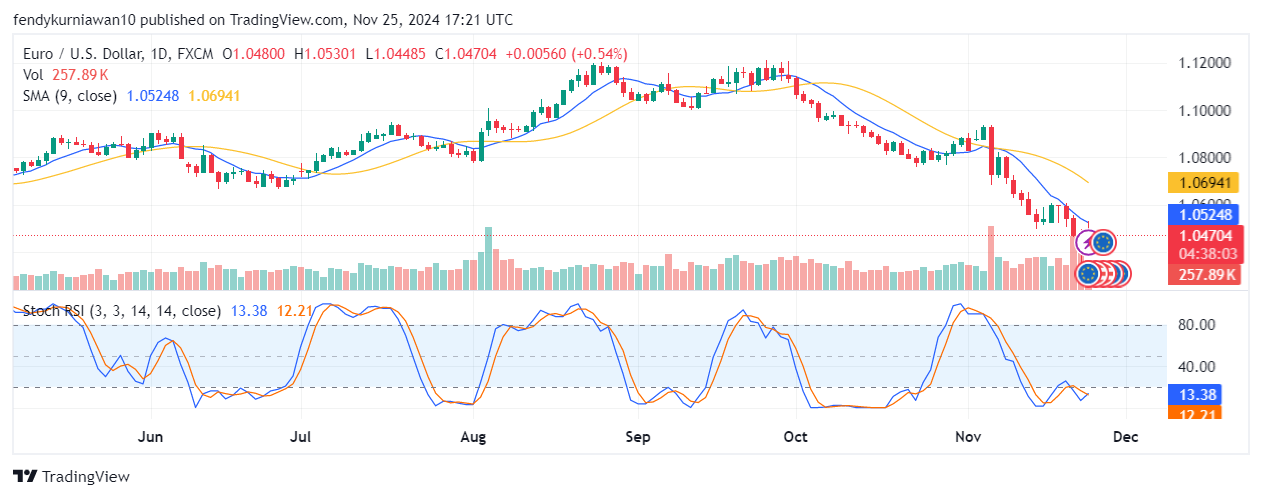
On the daily timeframe, EUR/USD shows a strong downtrend, as indicated by the price remaining below the SMA 9. This signals bearish dominance in recent weeks. The current price is hovering around 1.0470, under significant selling pressure.

Support and Resistance
- Key resistance: 1.0694 (SMA 9, nearest supply area).
- Strong support: 1.0448 (a psychological level that previously acted as a consolidation zone).
Technical Indicators
- Stochastic RSI: Indicates oversold conditions (below 20), hinting at the possibility of a bullish correction in the near term.
- Volume: High activity in volume suggests this zone is a critical area monitored by major market players.
Daily Conclusion: The long-term trend remains bearish, but a correction toward the 1.0694 resistance is possible if oversold momentum builds up.
EUR/USD H4 Analysis
Trend
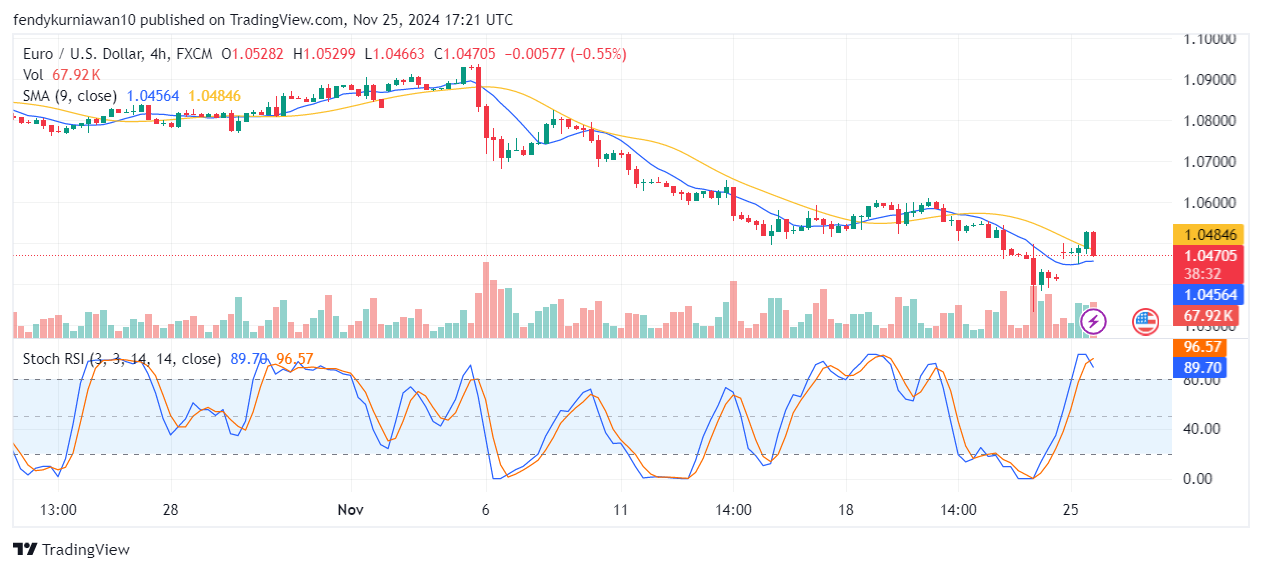
The H4 timeframe confirms a bullish pullback from the support level of 1.0445, suggesting the price is attempting to break above the 1.0485 resistance (SMA 9). However, the primary trend remains bearish, making this movement likely temporary.

Support and Resistance
- Key resistance: 1.0485 (SMA 9 and nearest supply area).
- Nearest support: 1.0445.
Technical Indicators
- Stochastic RSI: Currently overbought (above 80), indicating the potential for a downward reversal unless a strong bullish catalyst emerges.
- Volume: Increased volume in the latest candle suggests the market is entering a critical zone.
H4 Conclusion: In the medium term, EUR/USD may correct downward if it fails to break the 1.0485 resistance.
EUR/USD H1 Analysis
Trend
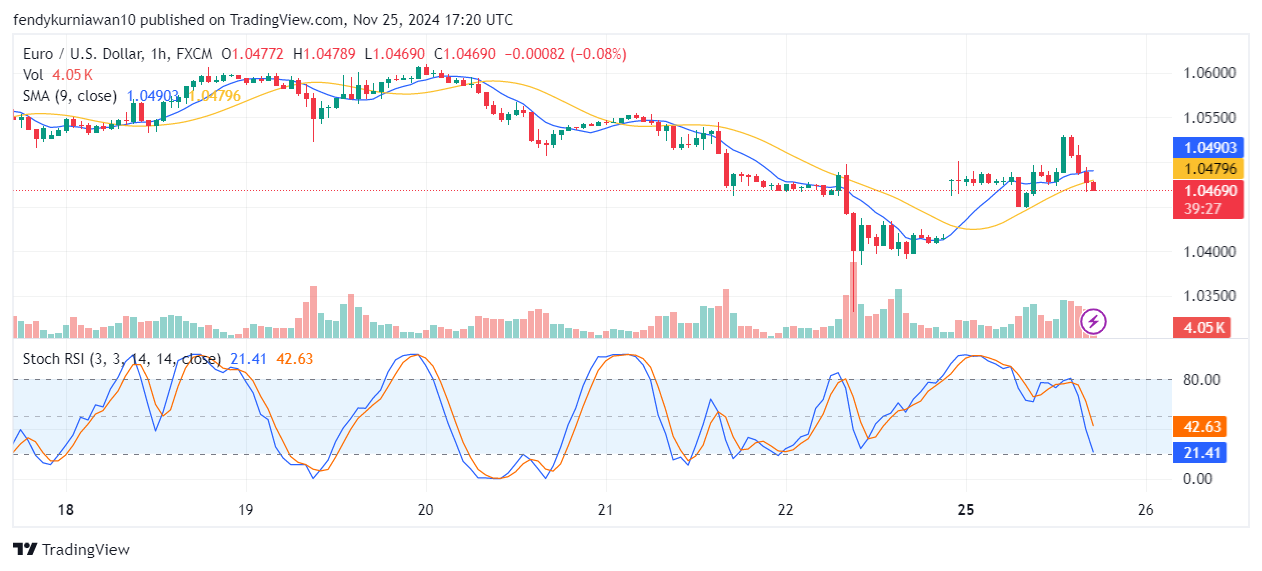
On the H1 timeframe, EUR/USD displays short-term consolidation, with price movement ranging between SMA 9 and the 1.0485 resistance.

Support and Resistance
- Nearest resistance: 1.0480.
- Strong support: 1.0465.
Read: How to identify support and resistance
Technical Indicators
- Stochastic RSI: Indicates neutral conditions around 42, suggesting the next move will depend on a breakout of support or resistance.
- Volume: Declining trading volume signals a lack of momentum in the current market.
H1 Conclusion: The short-term trend remains unclear, with the next movement depending on a breakout.
EUR/USD Forecast
Based on the technical analysis across all timeframes:
- Short-term: Likely to consolidate between 1.0465 and 1.0485 before a breakout.
- Long-term: The downtrend remains dominant, targeting the psychological support at 1.0400. However, the bullish divergence on the Stochastic RSI in the daily timeframe could trigger a correction toward 1.0694.
Trading Recommendations
Based on the analysis above, here are trading recommendations for EUR/USD:
- Entry points:
- Sell around 1.0480 if the price fails to break out.
- Buy if the price breaks above 1.0490 with a confirmed bullish candle.
- Take Profit (TP):
- For sell positions: 1.0445.
- For buy positions: 1.0550.
- Stop Loss (SL):
- For sell positions: 1.0495.
- For buy positions: 1.0465.
Reasoning: This strategy takes into account oversold conditions on the daily timeframe and the potential for short-term reversal on the H4 and H1 timeframes.
Join the TDS Community
If you’re looking for a safe and reliable forex trading community, join TDS Community. We provide free copy trading services directly from top traders on MQL5, with no subscription fees or VPS costs. Experience secure trading with a professional community!
Unlock your trading potential today at TDSCopyTrade.com. Join now and become part of a successful trading community!


