

Overview
The NZD/USD pair shows interesting movements across different timeframes based on the latest technical analysis. With a long-term weakening trend, traders can take advantage of price movements by applying the right strategy. This analysis covers the 1-hour (1H), 4-hour (4H), and daily timeframes, focusing on trends, support and resistance levels, and technical indicators such as SMA and Stochastic RSI.
NZD/USD Analysis on 1-Hour (1H) Timeframe
Trend
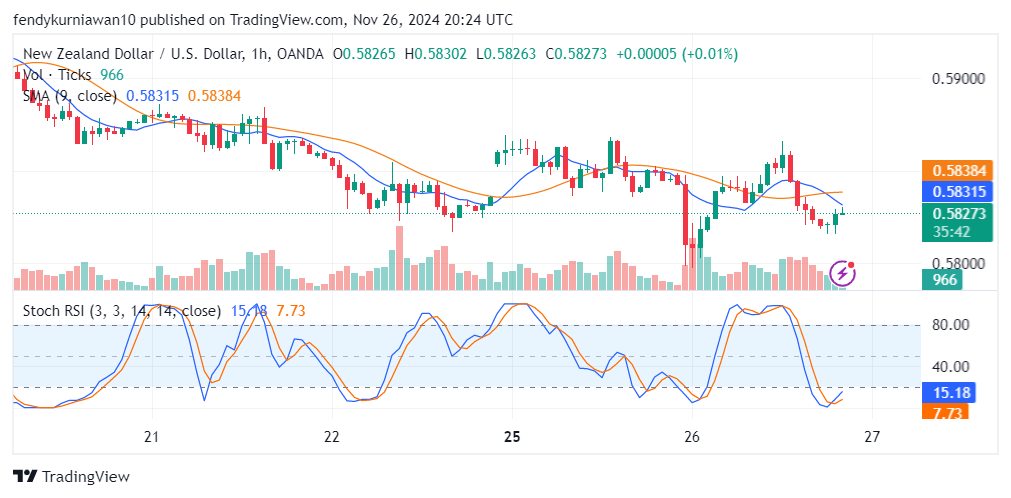
On the 1-hour timeframe, NZD/USD is currently in a short-term downtrend. The SMA 9 (blue line) is below the SMA 20 (orange line), indicating consistent bearish pressure.
Support and Resistance
- Nearest support: 0.5800, a strong psychological level that has been tested multiple times.
- Nearest resistance: 0.5838, aligning with the SMA 20, which acts as a dynamic barrier.
Technical Indicators
- Stochastic RSI: The indicator is in the oversold area (15.18), suggesting a potential short-term rebound, although the main trend remains bearish.
- Volume: Trading volume remains stable with minor spikes near the support level.
NZD/USD Analysis on 4-Hour (4H) Timeframe
Trend
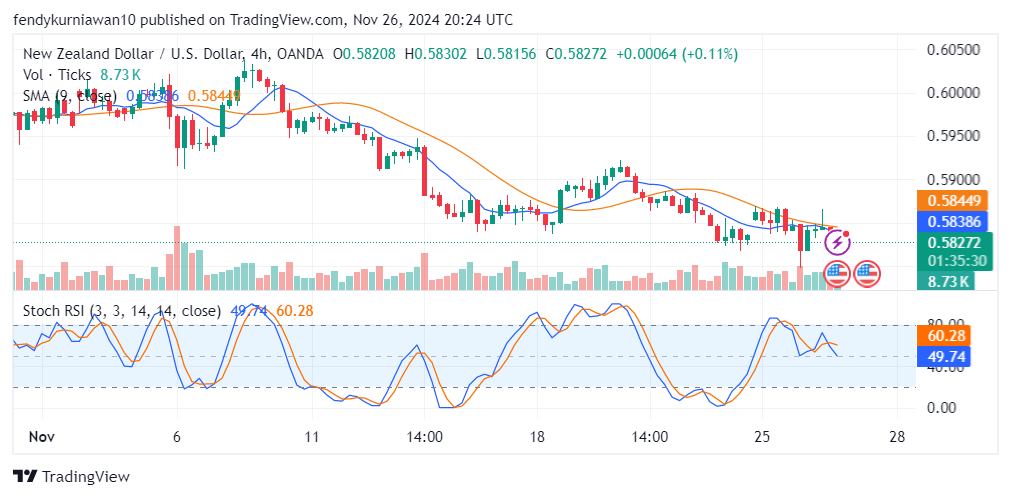
On the 4-hour timeframe, the downtrend is more evident. The SMA 9 is also below the SMA 20, showing dominance from sellers over the past few days.
Support and Resistance
- Key support: 0.5785, a level that has not yet been breached despite significant bearish pressure.
- Key resistance: 0.5845, a level coinciding with the SMA 20 on this timeframe.
Technical Indicators
- Stochastic RSI: Currently at 60.28, indicating limited bullish momentum and the likelihood of price weakening after a brief recovery attempt.
- Volume: Trading volume increases near the resistance level, signaling selling activity at those levels.
NZD/USD Analysis on Daily (1D) Timeframe
Trend
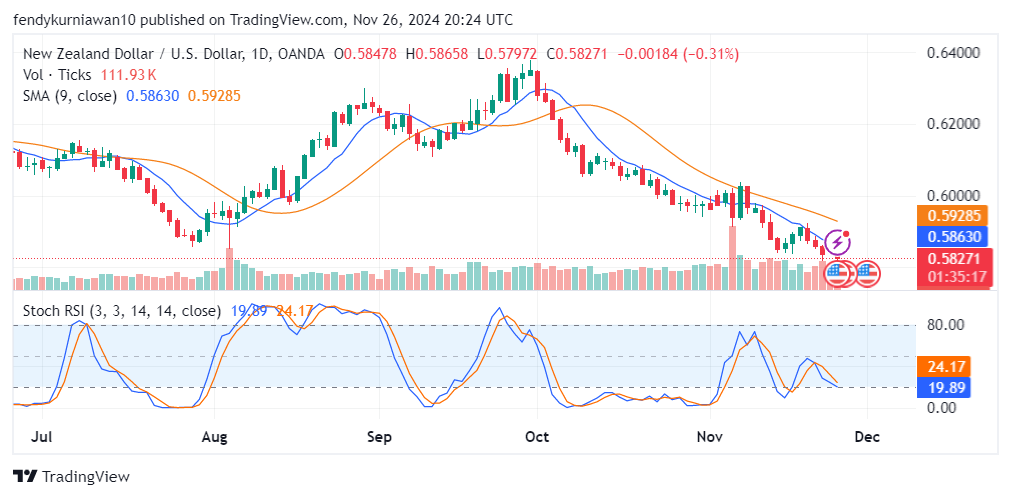
On the daily timeframe, NZD/USD remains in a long-term downtrend. This is supported by price consistently moving below the SMA 20 and forming lower highs over the past few months.
Support and Resistance
- Key support: 0.5750, a significant lower boundary if bearish pressure continues.
- Key resistance: 0.5863, a level that failed to break in the previous week.
Read: How to identify support and resistance
Technical Indicators
- Stochastic RSI: The indicator is near the oversold area (19.89), suggesting a potential short-term pullback, although the main trend remains bearish.
- Volume: Trading volume is lower than in previous sessions, reflecting a lack of buyer interest at current levels.
NZD/USD Price Predictions
- Short-term: Prices are likely to pull back to the nearest resistance (0.5838 on the 1H timeframe) before resuming their decline.
- Long-term: The bearish trend will remain dominant as long as the price stays below the key resistance level (0.5863).
NZD/USD Trading Recommendations
Based on the analysis above, here are the trading recommendations for the NZD/USD pair:
- Recommended position: Sell
- Entry point: 0.5825 (pullback area near 1H resistance)
- Take profit (TP): 0.5785 (key support on the 4H timeframe)
- Stop loss (SL): 0.5850 (above key resistance on the 4H timeframe)
Reasons:
- The main trend across all timeframes is bearish.
- SMA and Stochastic RSI indicators confirm selling pressure.
- Support and resistance levels provide clear entry and target points.
Call to Action
Join TDS Community, a trading community that offers copy trading from top traders on MQL5 with no subscription fees and no VPS rental costs. With TDS Community, you can enjoy safer and more guided trading through proven strategies. Visit TDSCopyTrade.com now to start trading safely and take advantage of opportunities in the forex market!
![]()


