

Currently, USD/JPY exhibits intriguing movements across different timeframes. This article provides an in-depth technical analysis, price predictions, and trading suggestions to help traders make more informed decisions.
USD/JPY Daily Analysis
On the Daily timeframe, USD/JPY is testing critical levels with price movements nearing the Bollinger Bands’ middle line.
Trend
Overall, the trend remains bullish, although momentum is showing signs of weakening. The price is approaching the Bollinger Bands’ middle line at 153.826, indicating potential consolidation or mild correction.
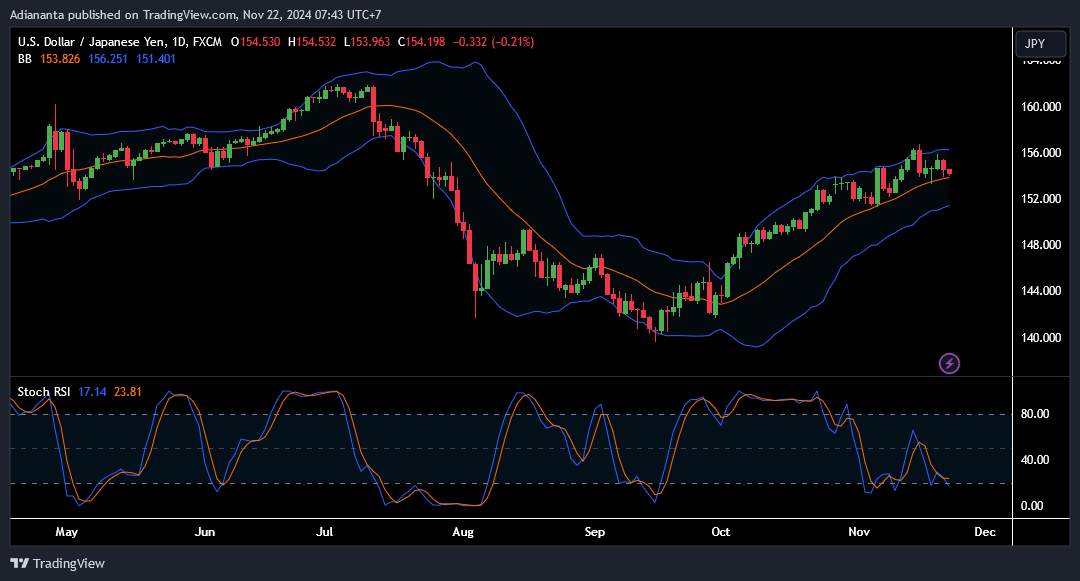
Support and Resistance
- Key Resistance: 156.251 (upper Bollinger Band)
- Strong Support: 151.401 (lower Bollinger Band)
Stochastic RSI Indicator
The Stochastic RSI is in the oversold zone (17.14), indicating a potential reversal or upward correction in the near term. However, further confirmation from price movements is required.
Read: XAU/USD Technical Analysis Today: Bullish!
USD/JPY 4H Analysis
On the 4-hour timeframe, USD/JPY shows a sideways movement with slight bearish pressure.
Trend
The medium-term trend is consolidating after reaching the upper band near 155.873. The price is now near the middle band (154.690), signaling selling pressure.
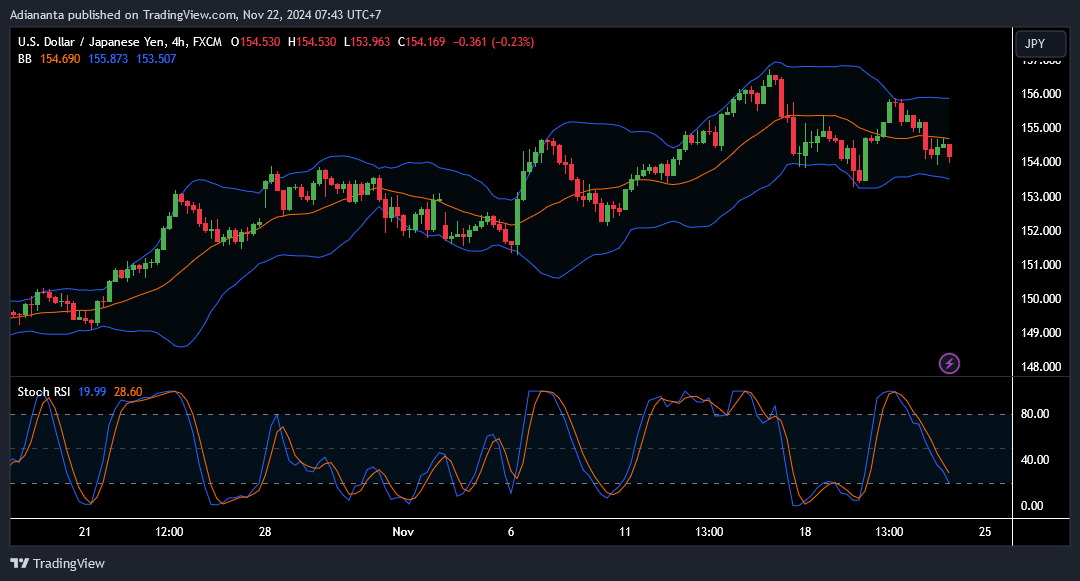
Support and Resistance
- Closest Resistance: 155.873 (upper Bollinger Band)
- Closest Support: 153.507 (lower Bollinger Band)
Stochastic RSI Indicator
The Stochastic RSI is at 19.99, which is also in the oversold zone. This suggests a possible price reversal to the upside, but bearish pressure still dominates.
Read: EUR/USD Technical Analysis Today: Bearish!
USD/JPY 1H Analysis
On the 1-hour timeframe, price movements display consistent selling pressure with a minor breakout below the middle band.
Trend
The price is in a short-term bearish trend with a potential break below the 153.980 support level.
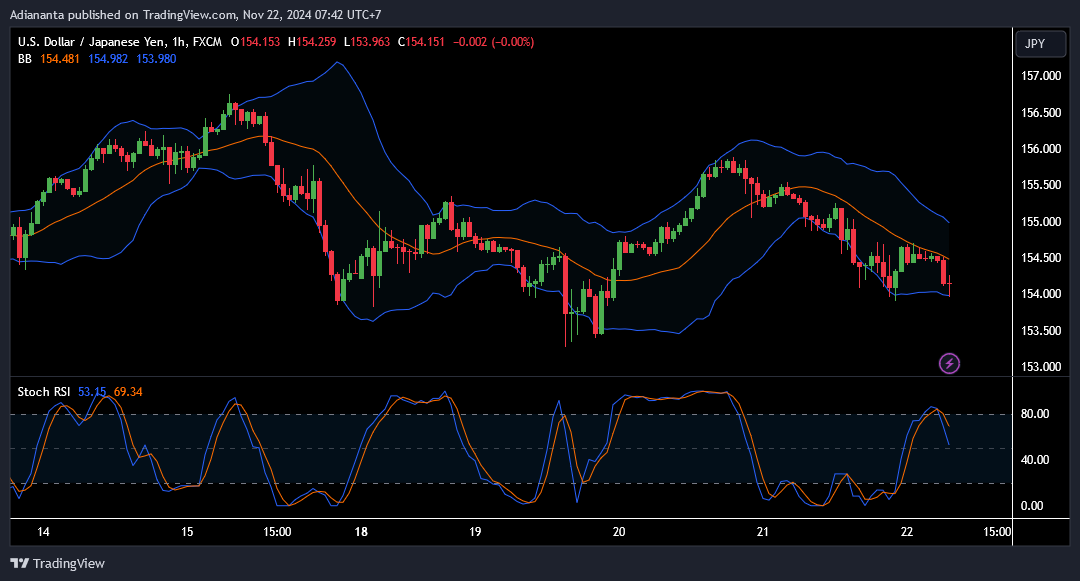
Support and Resistance
- Closest Resistance: 154.982 (upper Bollinger Band)
- Closest Support: 153.980 (lower Bollinger Band)
Stochastic RSI Indicator
The Stochastic RSI is hovering near the 50 level, indicating weakening bearish momentum. However, a bullish reversal still requires confirmation.
Read: GBP/USD Technical Analysis Today: Bearish!
USD/JPY Price Predictions
- Short-term: USD/JPY is likely to test the 153.980 support level before a possible rebound.
- Long-term: As long as the price stays above 151.401, the bullish trend on the Daily timeframe is expected to persist.
Trading Suggestions
Based on the technical analysis above, here is a trading recommendation for USD/JPY:
- Buy Entry: 154.000 (if a rebound occurs from the support level)
- Take Profit (TP): 155.500
- Stop Loss (SL): 153.500
Rationale:
- Oversold zones on Stochastic RSI across all timeframes suggest a potential price reversal.
- The 153.980 level serves as a strong short-term support.
Read: How to identify support and resistance
Join the TDS Community
The TDS Community offers free copy trading services from top traders on the MQL5 platform without any subscription or VPS rental fees. By joining, you can replicate professional trading strategies and increase your profit potential without the hassle of managing your own account. Join now and become a part of Trading Dengan Selamat to discover safe trading opportunities with our global trading community!
![]()


