

Gold (XAU/USD) is exhibiting strong bullish momentum after a period of consolidation and price correction. Based on a multi-timeframe analysis, gold is approaching a significant resistance area with potential for either a reversal or a continuation of the trend. This article will delve into the technical conditions of XAU/USD on the Weekly, Daily, and 4H timeframes, along with price movement predictions and actionable trading advice.
XAU/USD Weekly Analysis
Trend
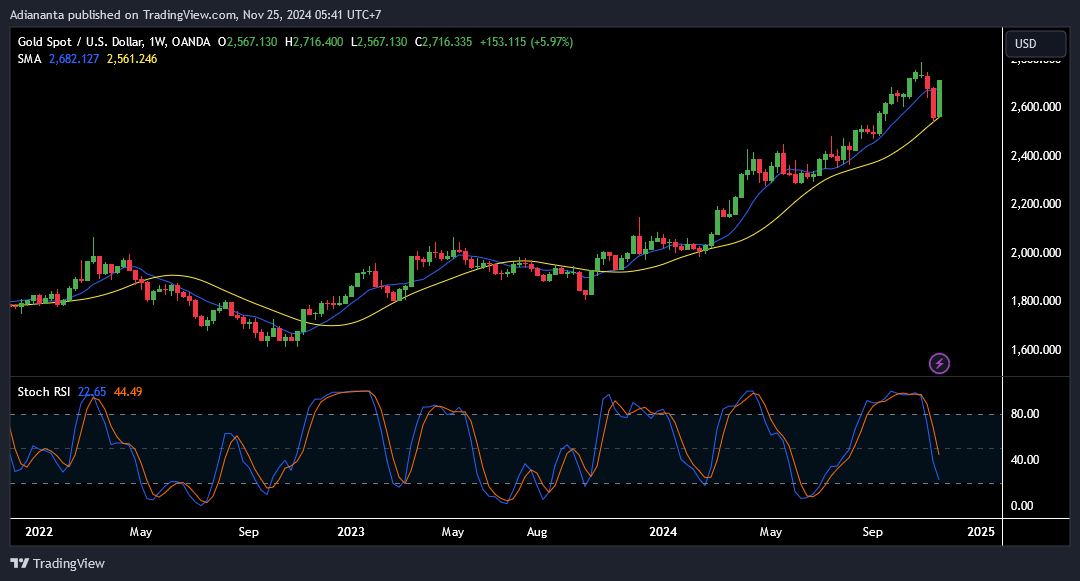
On the Weekly timeframe, XAU/USD remains in a long-term uptrend, as indicated by its position above the 50 and 20 Simple Moving Averages (SMAs). Significant upward movement has been seen over the past months, though a minor correction occurred in the previous week.
Support and Resistance
- Support: $2,561 (20-week SMA).
- Resistance: $2,716 (previous weekly high).
Indicators
- Stochastic RSI: Shows a rebound signal from the oversold area (22.65 and 44.49), indicating a potential long-term recovery.
Conclusion
The Weekly timeframe supports further upward momentum, but confirmation is needed for short-term price action.
Read more: USD/JPY Technical Analysis This Week: Still Bullish!
XAU/USD Daily Analysis
Trend
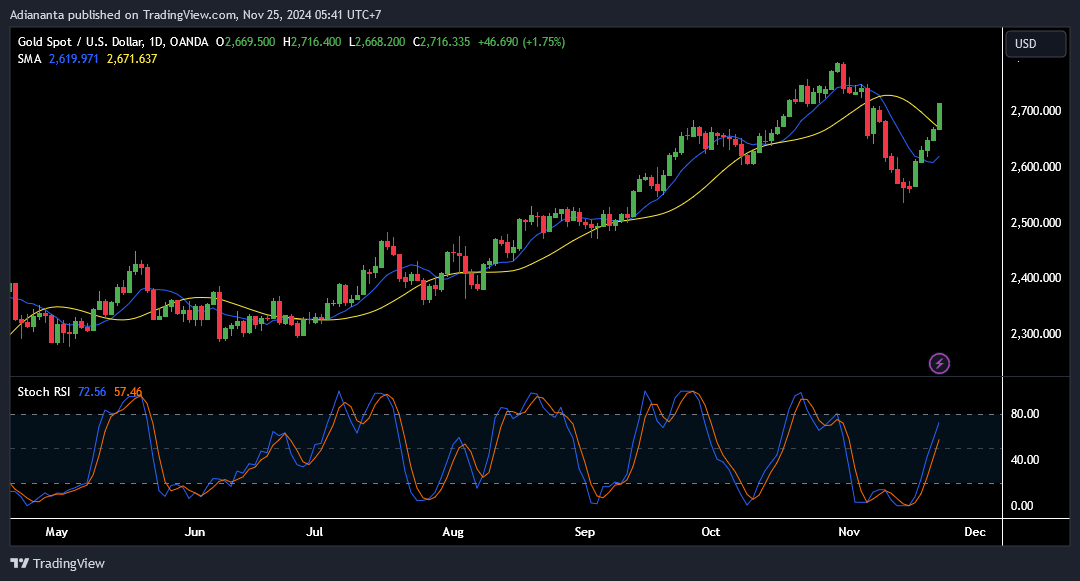
On the Daily timeframe, XAU/USD has bounced off the 50 SMA support level at $2,619, showing strong bullish momentum. The 20 SMA is now trending upward, supporting a potential continuation of the uptrend.
Support and Resistance
- Support: $2,671 (20-day SMA).
- Resistance: $2,716 (daily high).
Indicators
- Stochastic RSI: Currently at 72.56 and 57.46, signaling bullish momentum with room for further upside toward the overbought area.
Candlestick Patterns
The last two candles form a bullish engulfing pattern, indicating strong buying interest.
Conclusion
On the Daily timeframe, XAU/USD is likely to retest the $2,716 resistance area before determining its next direction.
Read more: GBP/USD Technical Analysis This Week: Bearish Continues!
XAU/USD 4H Analysis
Trend
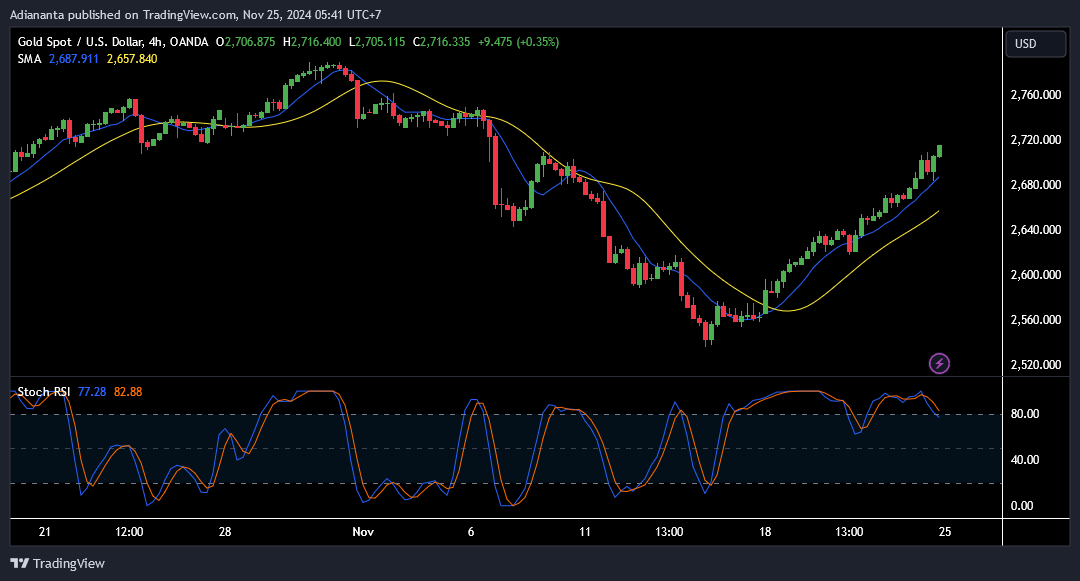
On the 4H timeframe, XAU/USD demonstrates a clearer bullish trend, with the price well above both the 20 and 50 SMAs.
Support and Resistance
- Support: $2,687 (20 SMA).
- Resistance: $2,716 (local resistance).
Indicators
- Stochastic RSI: Currently overbought at 77.28 and 82.88, suggesting a potential short-term pullback before resuming the uptrend.
Candlestick Patterns
The pattern of higher highs and higher lows confirms the bullish trend on this timeframe.
Conclusion
A minor correction may occur, but the bullish trend remains dominant in the short term.
Read: How to identify support and resistance
Price Movement Prediction
Based on the technical analysis across all timeframes:
- Short term: A minor pullback to the $2,687 area (20 SMA on 4H).
- Medium term: Likely breakout of the $2,716 resistance toward $2,750.
- Long term: Continued upward movement if the weekly resistance at $2,716 is breached with strong volume.
Trading Suggestions
- Recommendation: Buy on pullbacks.
- Entry point: $2,687 (20 SMA on 4H).
- Take profit (TP): $2,750 (next resistance).
- Stop loss (SL): $2,650 (below 20 SMA support on the Daily timeframe).
Reasoning
With the bullish trend supported by technical indicators like SMA and Stochastic RSI, the probability of profit is higher by following the main trend. Minor corrections can be utilized for entries with minimal risk.
Read more: Risk Management in Forex Trading
Join the TDS Community!
If you’re looking to receive regular technical analysis like this and follow copy trading strategies from professional traders, join the TDS Community! We offer free copy trading services through the MQL5 platform with no subscription fees or VPS costs. Join now and enhance your profit potential safely and reliably! Click join button below here now!
![]()


