

Gold prices continue to command attention as XAU/USD exhibits contrasting movements across different timeframes. While the shorter timeframes highlight a cautious bearish sentiment, the broader picture paints a bullish outlook. In this analysis, we will explore the price action on the hourly, 4-hour, and daily charts, breaking down trends, support and resistance zones, and the impact of key technical indicators. Whether you’re a short-term trader or a long-term investor, this guide will provide actionable insights and predictions for the days ahead.
XAU/USD 1H Analysis: Short-Term Struggles Persist
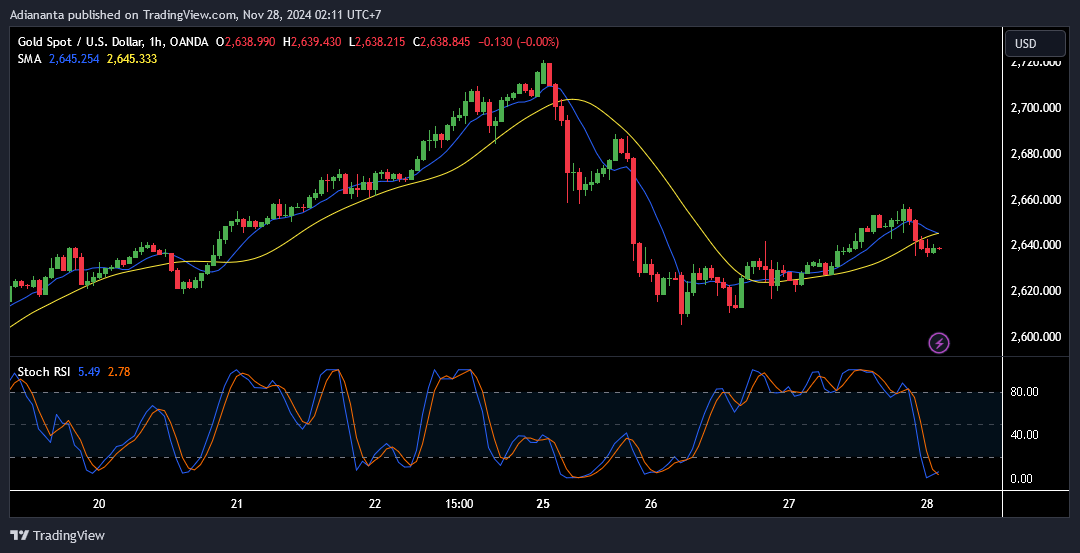
The hourly chart reveals a downtrend, with sellers dominating recent sessions. The price has struggled to maintain strength above $2,645, with bearish momentum driving the pair to test the $2,638 zone.
Trend
In the short term, gold remains under pressure. The sequence of lower highs and lower lows signals the continued presence of bears. However, with the Stochastic RSI entering oversold territory, a bounce may be on the horizon.
Support and Resistance
- Support: The $2,630 level emerges as a vital barrier against further declines, followed by a stronger floor around $2,620.
- Resistance: On the upside, $2,645 acts as a hurdle, with $2,655 presenting a more significant resistance level to overcome.
Technical Indicators
- Moving Averages: Both the 20 and 50 SMAs slope downward, reinforcing the bearish trend.
- Stochastic RSI: Currently at 5.49, the indicator signals an oversold market, hinting at potential near-term buying opportunities.
This tug-of-war between buyers and sellers makes the short-term outlook critical for day traders looking to capitalize on any reversals or breakouts.
XAU/USD 4H Analysis: Consolidation with a Bullish Undertone
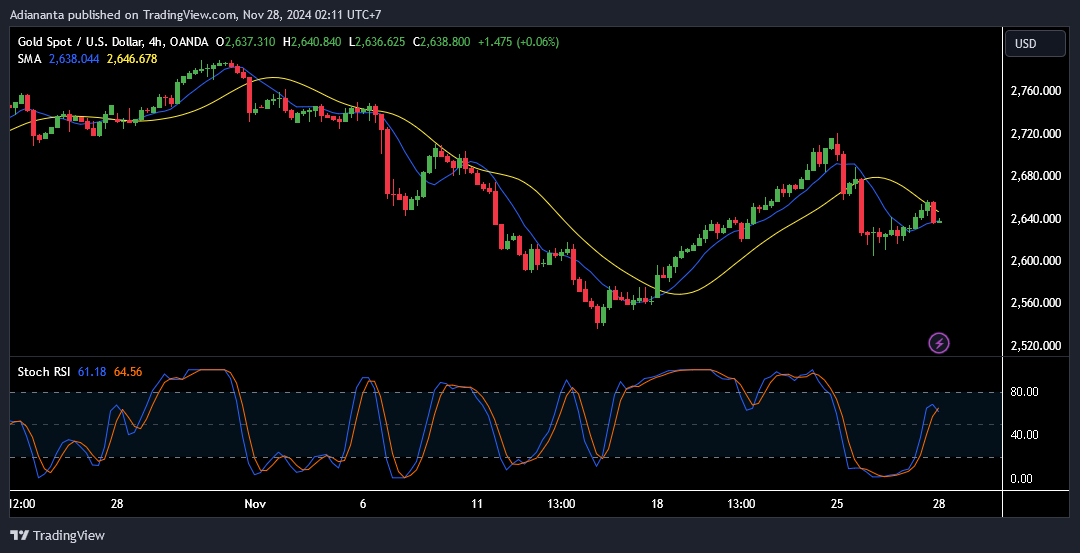
Zooming out to the 4-hour chart, the narrative shifts slightly. After enduring a steady downtrend, gold is finding some stability, moving into a sideways-to-slightly-upward trajectory. The price appears to be consolidating as it navigates through a crucial inflection zone.
Trend
The recovery from the $2,600 mark has provided some breathing room for buyers, though the pair remains capped under key resistance levels. The sideways price action reflects indecision, with neither bulls nor bears in full control.
Support and Resistance
- Support: Immediate support lies at $2,636, reinforced by recent consolidations, with a broader safety net at $2,620.
- Resistance: Key levels to watch include $2,655 and $2,670, where the 50 SMA and prior selling pressures converge.
Technical Indicators
- Moving Averages: A bearish crossover, where the 20 SMA dips below the 50 SMA, indicates lingering bearish pressure.
- Stochastic RSI: Hovering around 61.18, the indicator suggests limited upside, but the potential for further recovery exists if volume picks up.
This timeframe captures a battle for momentum. Traders eyeing medium-term positions should prepare for price swings within this consolidative structure.
XAU/USD Daily Analysis: Long-Term Uptrend Holds Firm
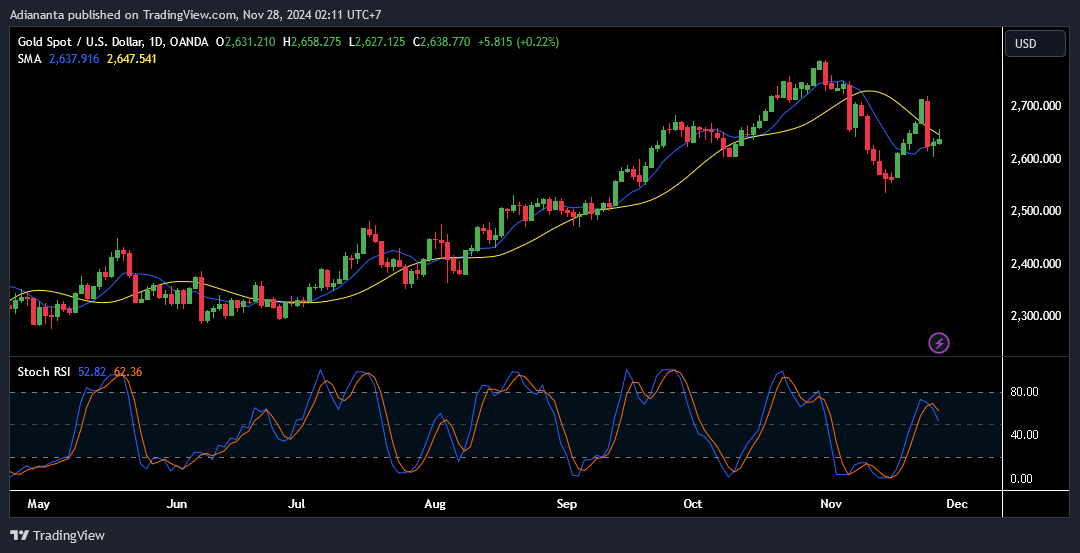
The daily chart tells a broader story of resilience. Despite short-term fluctuations, the long-term uptrend remains intact, with gold consistently printing higher highs since mid-year. However, recent corrections indicate that bulls need fresh momentum to regain control.
Trend
The overarching trend remains bullish. The recent dip appears to be a healthy correction within the larger rally. Gold’s ability to hold above $2,630 is a testament to the strength of its upward trajectory.
Support and Resistance
- Support: $2,630 is a key level to watch, followed by the critical psychological threshold at $2,600.
- Resistance: Bulls are targeting $2,680 in the near term, with $2,700 serving as a major milestone for further advances.
Technical Indicators
- Moving Averages: Both the 20 and 50 SMAs support the uptrend, reflecting underlying bullish momentum.
- Stochastic RSI: Positioned at 62.36, the indicator suggests that gold has room to climb further, assuming buying interest sustains.
For swing traders and investors, this timeframe reinforces confidence in the bullish outlook, provided gold can break through near-term resistance zones.
Read: How to identify support and resistance
Predictions: What Lies Ahead for XAU/USD?
Short-Term (1H and 4H)
In the short term, expect a modest recovery toward $2,645-$2,650. However, a break below $2,630 could pave the way for a deeper pullback to $2,620.
Long-Term (Daily)
The long-term trend remains poised for a continuation higher, with targets set at $2,680 and $2,700 if bullish momentum returns.
Trading Advice: Strategies for Bulls and Bears
For Bulls:
- Entry Point: $2,636 (buy near support).
- Take Profit: $2,680-$2,700.
- Stop Loss: $2,620 to minimize downside risk.
For Bears:
- Entry Point: $2,645 (sell near resistance).
- Take Profit: $2,630.
- Stop Loss: $2,660 to avoid being trapped by a breakout.
These strategies cater to different market conditions, allowing traders to adapt to both breakouts and reversals effectively.
Trade Smart, Trade with TDS Community
Gold’s intricate dance between bullish and bearish forces underscores the importance of timely insights and strategies. Don’t navigate this volatile market alone. Join the TDS Community today and elevate your trading journey. With free copy trading from top traders on MQL5, no subscription fees, and no VPS costs, you’ll have access to expert strategies and tools to trade securely and confidently.
What are you waiting for? Let’s make your trading goals a reality with TDS Community. Click here to join now!
![]()


