

Gold (XAU/USD) has been trading within a consolidation phase, with prices showing indecisiveness around key levels. After a period of bullish momentum earlier in the year, the yellow metal is now navigating a critical juncture. With price action hovering near moving averages and oscillators signaling potential reversals, traders are eyeing the next significant move. Will gold break higher, or is a pullback imminent? In this article, we’ll dissect the daily, 4-hour, and 1-hour charts to uncover actionable insights and trading strategies.
XAU/USD Daily Analysis: Testing the Bullish Trendline
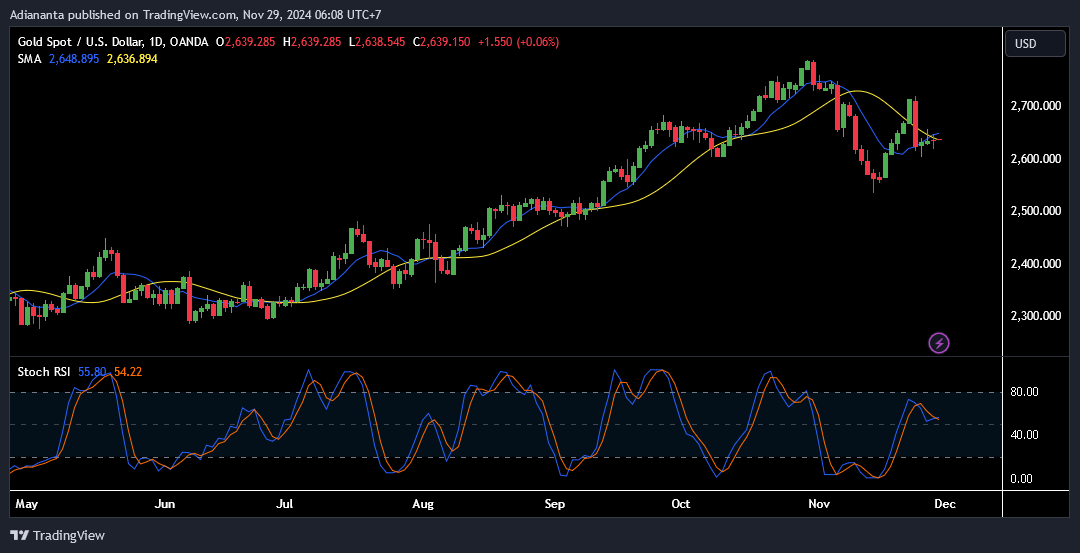
Gold’s daily chart paints a mixed picture. The longer-term bullish structure, evident from the series of higher lows since October, is intact. However, recent sessions suggest waning momentum as the price tests critical support levels near $2,640.
Trend: A Bullish Hold Under Pressure
Gold has maintained an uptrend on the daily timeframe, as evidenced by the golden cross of the 20-SMA over the 50-SMA earlier in the quarter. This pattern is often seen as a strong bullish signal. Yet, the price is now at a critical juncture, straddling both moving averages. If the price sustains above the 50-SMA, the bullish structure could remain intact. A break below, however, might trigger more downside pressure.
Support and Resistance: Key Levels in Focus
- Immediate Support: $2,630, marked by the 50-SMA.
- Resistance: $2,680 and $2,700, the latter being a psychological and technical barrier. These levels act as guideposts for traders, with $2,630 serving as a key decision point for bulls, and $2,700 likely to attract sellers.
Indicators: Stochastic RSI Signals a Pause
The Stochastic RSI is currently at 55.80, showing that momentum has moderated. It’s neither in the overbought nor oversold zone, reflecting indecision in the market. This equilibrium suggests a potential tug-of-war between buyers and sellers.
XAU/USD 4-Hour Analysis: Sideways Grind Amid Low Volatility
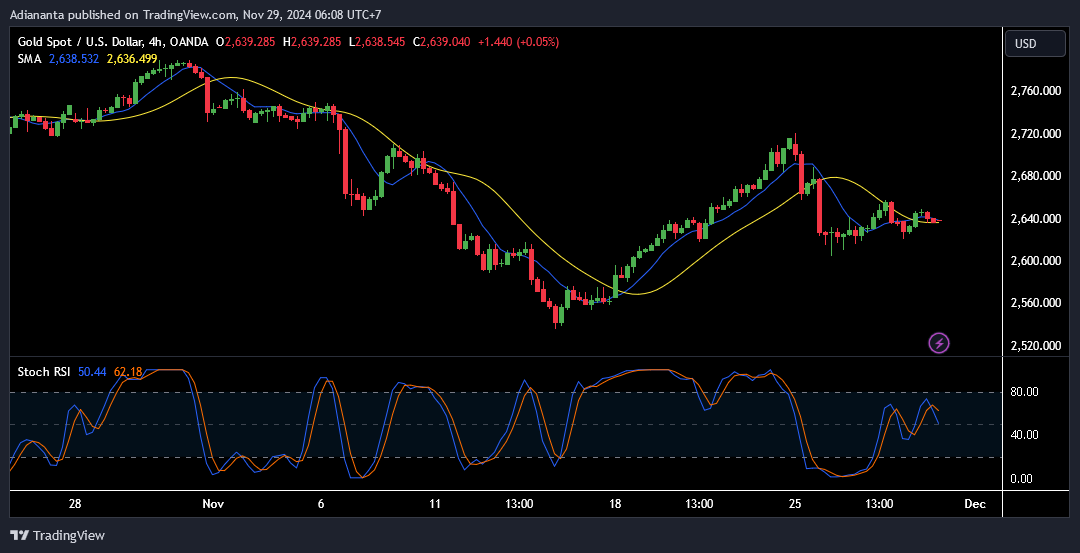
Zooming into the 4-hour chart, gold appears to be consolidating within a tighter range. This timeframe highlights a sideways movement as traders hesitate to commit in either direction.
Trend: Rangebound but with a Bearish Tilt
Recent price action has seen gold fail to break above $2,680, with sellers stepping in to cap gains. Meanwhile, support near $2,620 continues to hold, creating a narrow trading channel. This sideways grind often precedes a breakout, making this timeframe especially critical to monitor.
Support and Resistance: Tighter Levels in Play
- Support: $2,620, reinforced by the 50-SMA.
- Resistance: $2,660–$2,680, which coincides with short-term highs. The market’s reluctance to break these levels reflects underlying uncertainty, but these zones are likely to determine the next decisive move.
Indicators: Oscillators Signal Imminent Movement
The Stochastic RSI is creeping toward the overbought zone at 62.18, indicating the possibility of a near-term pullback. Combined with the moving averages flattening out, this suggests the market is in a wait-and-see mode.
XAU/USD 1-Hour Analysis: Oversold Conditions Could Trigger a Bounce
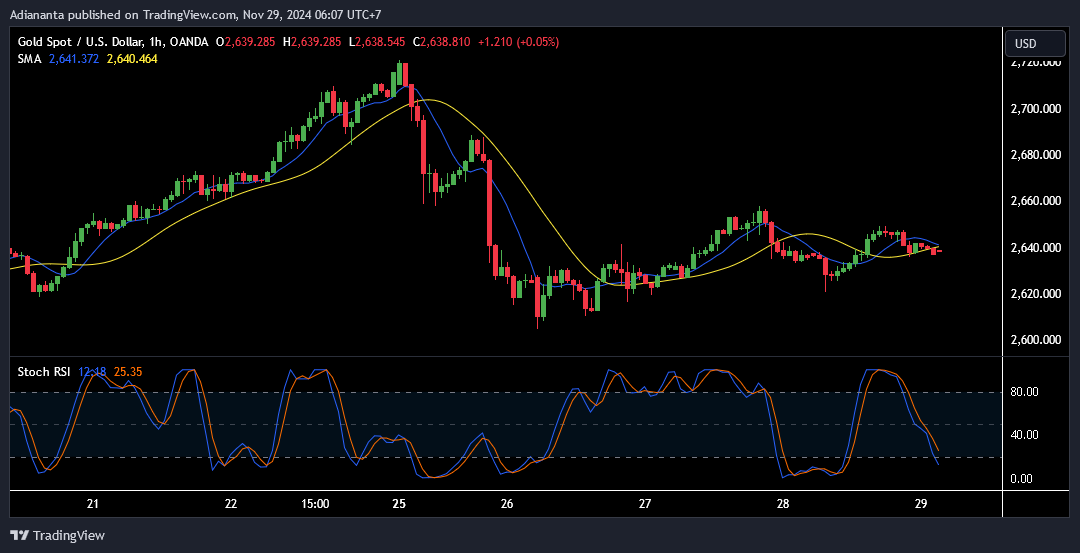
The 1-hour chart provides a more dynamic view of short-term sentiment. Here, we see gold struggling to hold above $2,640, with bears appearing to dominate intraday moves.
Trend: Short-Term Weakness
Gold is forming lower highs, a classic sign of bearish pressure. Price is currently hovering below the 20-SMA, signaling that sellers have the upper hand for now. This weakness could persist unless bulls step in near critical support.
Support and Resistance: Narrow Levels for Scalpers
- Support: $2,635, where the price has found some footing in the past few sessions.
- Resistance: $2,645–$2,650, limiting upward movements in the short term. Traders operating on this timeframe may find opportunities within these tight levels, but a breakout will likely determine the next meaningful move.
Indicators: Stochastic RSI Flashes Oversold Signal
With the Stochastic RSI sitting at 25.35, the 1-hour chart indicates oversold conditions. This suggests the potential for a short-term bounce, though the broader trend remains bearish.
Prediction for XAU/USD: Consolidation Before the Break
Gold appears poised for consolidation across all timeframes.
Short-Term Forecast (1-2 Days):
- Expect range-bound trading between $2,620 and $2,680.
- A short-term bounce could occur if oversold signals on the 1-hour chart play out.
Medium-Term Forecast (1 Week):
- If gold breaks above $2,680, it could retest $2,720 as bullish momentum picks up.
- A break below $2,630, however, could open the door to a test of $2,600.
Long-Term Forecast (1 Month):
- Gold remains in a broader uptrend. As long as it holds above $2,600, the bullish case remains intact, with a potential rally toward $2,750 in December.
Read: How to identify support and resistance
Trading Advice: Play the Range with Caution
Given the current setup, here are two potential trading strategies:
- Buy the Dip:
- Entry: $2,635.
- Take Profit: $2,680.
- Stop Loss: $2,620.
- Rationale: Oversold conditions on the 1-hour chart suggest a short-term bounce.
- Sell Near Resistance:
- Entry: $2,675.
- Take Profit: $2,640.
- Stop Loss: $2,690.
- Rationale: Repeated rejection of $2,680 resistance favors selling opportunities for short-term traders.
These strategies balance short-term opportunities with clear risk management, ensuring traders are protected from abrupt market reversals.
Join the TDS Community
The gold market is at a crossroads, offering a compelling setup for both range traders and breakout hunters. As the metal consolidates, the next significant move could set the tone for the remainder of the year. Will gold’s bulls defend the uptrend, or will bears take control?
To enhance your trading edge, join the TDS Community—a trusted hub for traders offering free copy trading services on MQL5. With no subscription fees or VPS costs, you can mirror the strategies of top traders and elevate your portfolio with ease. Take the next step toward smarter trading and become part of a growing community dedicated to trading securely and profitably. Don’t miss out—join today and transform your trading journey!
![]()


