

The USD/CAD currency pair shows an intriguing movement across several timeframes based on the latest chart data. This article will analyze USD/CAD price movements on the 1-hour (H1), 4-hour (H4), and daily timeframes, identifying potential trends, support and resistance areas, and providing clear trading recommendations for traders.
USD/CAD Analysis on H1 Timeframe
Trend
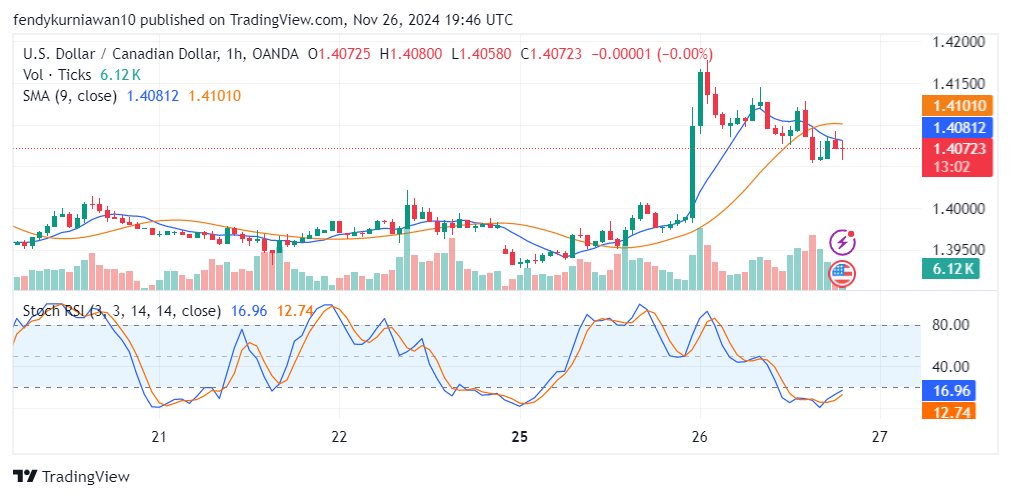
On the H1 timeframe, USD/CAD appears to be in a consolidation phase after a sharp rally. The current price hovers around 1.4070, with the SMA-9 slightly above the current price, indicating short-term bearish pressure. The Stochastic RSI shows an oversold signal at 12.74, suggesting a potential upward reversal.
Support and Resistance
- Support: 1.4050 (recent local low area).
- Resistance: 1.4100 (SMA-9 level and closest psychological level).
This indicates that a strong support level could trigger a rebound, while resistance at 1.4100 needs to be breached to confirm a bullish continuation.
USD/CAD Analysis on H4 Timeframe
Trend
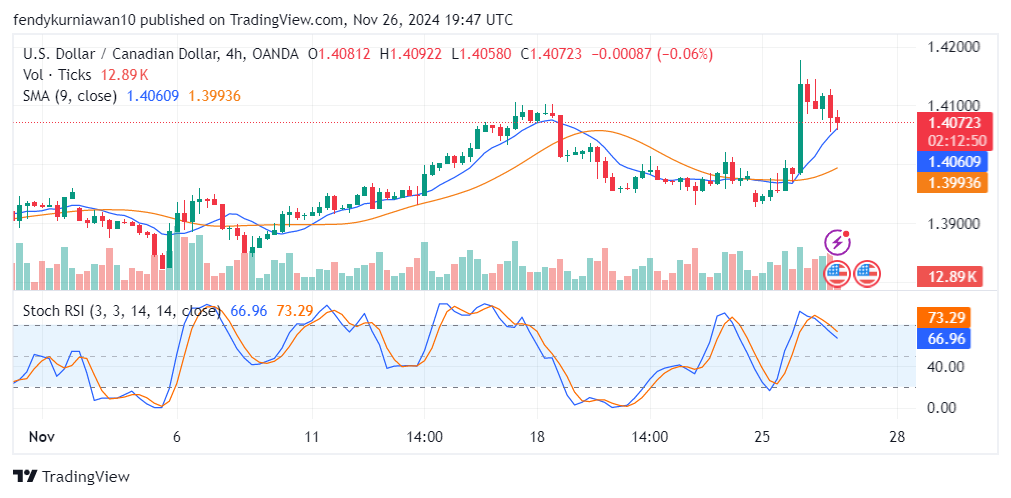
On the H4 timeframe, USD/CAD remains bullish overall, with price staying above the SMA-9. The price has tested resistance at 1.4100 multiple times but has not closed above it. The Stochastic RSI is at 73.29, nearing the overbought zone, signaling a potential short-term correction before further upward movement.
Support and Resistance
- Support: 1.4060 (SMA-9 level) and 1.3990 (strong underlying support).
- Resistance: 1.4150 (recent high).
If the price successfully breaks the resistance at 1.4150, the potential for an upward move to the 1.4200 area becomes highly probable.
USD/CAD Analysis on Daily Timeframe
Trend
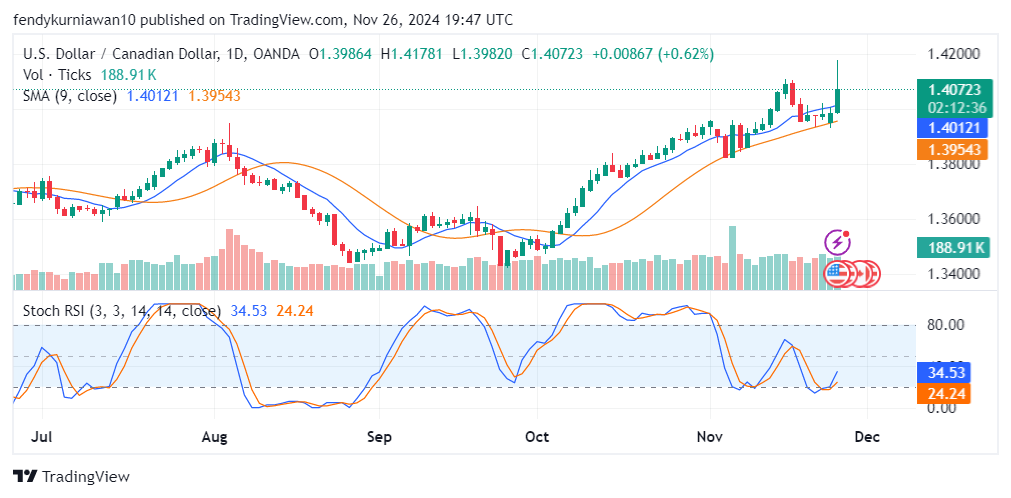
On the Daily timeframe, the bullish trend appears stronger, with the price successfully breaking above the SMA-9 at 1.4012. Price action remains in an uptrend since early November. The Stochastic RSI at 34.53, currently in a neutral zone, offers room for further upward movement before entering the overbought area.
Support and Resistance
- Support: 1.4010 (SMA-9 level) and 1.3950 (major support area).
- Resistance: 1.4170 (strong long-term resistance).
A breakout above the 1.4170 level would confirm bullish momentum for a move toward 1.4300 or higher.
Read: How to identify support and resistance
USD/CAD Price Prediction
Based on technical analysis across all timeframes:
- In the short term (H1), the price may rebound from the 1.4050 support level toward the 1.4100 resistance.
- In the medium term (H4), the bullish trend remains dominant, though a slight correction to 1.4060 could occur before further gains.
- In the long term (Daily), a breakout above 1.4170 would act as a catalyst for a significant bullish move.
Trading Recommendations
Based on the analysis above, here are the trading recommendations for USD/CAD:
- Buy Option:
- Entry Point: 1.4060 (near the SMA-9 support area on H4).
- Take Profit (TP): 1.4150 (nearest resistance on H4).
- Stop Loss (SL): 1.4030 (below major support).
- Alternative Sell Option (If Support Breaks):
- Entry Point: 1.4040 (if 1.4050 support is broken).
- Take Profit (TP): 1.3990 (strong support below).
- Stop Loss (SL): 1.4070 (above the breakout level).
Call to Action: Join the TDS Community
Looking to enhance your trading experience? Join the TDS Community, a trusted trading network offering copy trading from top traders on MQL5. Enjoy the service with no subscription fees and no VPS costs, so you can focus on safer and more effective trading. Visit TDSCopyTrade.com now for more information!
![]()


