

USD/JPY offers exciting opportunities this week, with price movements indicating consolidation across multiple timeframes. In this article, we will analyze the H4, Daily, and Weekly charts to understand trends, support-resistance levels, and potential future movements. Let’s dive in!
USD/JPY H4 Analysis
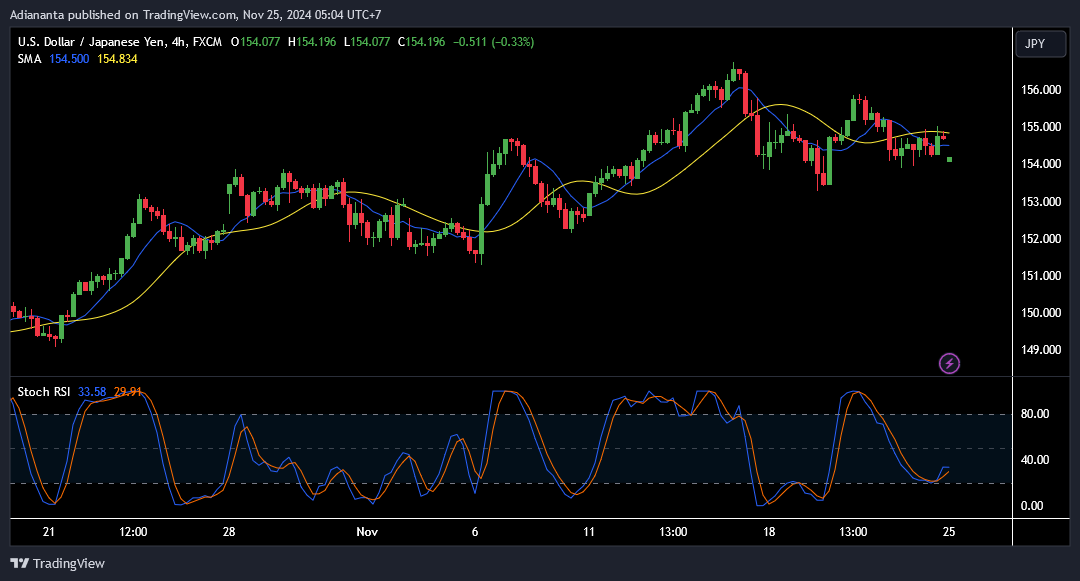
On the H4 timeframe, USD/JPY is showing signs of consolidation within a tight price range.
Trend
- Status: Sideways
The price is moving within the 154.000-155.000 range, lacking strong bullish or bearish momentum.
Support and Resistance
- Key resistance: 155.200
- Key support: 153.800
The price is bouncing between these levels, reflecting a consolidation zone.
Technical Indicators
- SMA (Simple Moving Average):
The SMA-14 and SMA-50 are relatively flat, signaling weak momentum. The SMA-50 is currently above the price, indicating short-term bearish pressure. - Stochastic RSI:
The Stochastic RSI is near the oversold region (33.58 and 29.91), suggesting a potential short-term rebound.
Read more: GBP/USD Technical Analysis This Week: Bearish Continues!
USD/JPY Daily Analysis
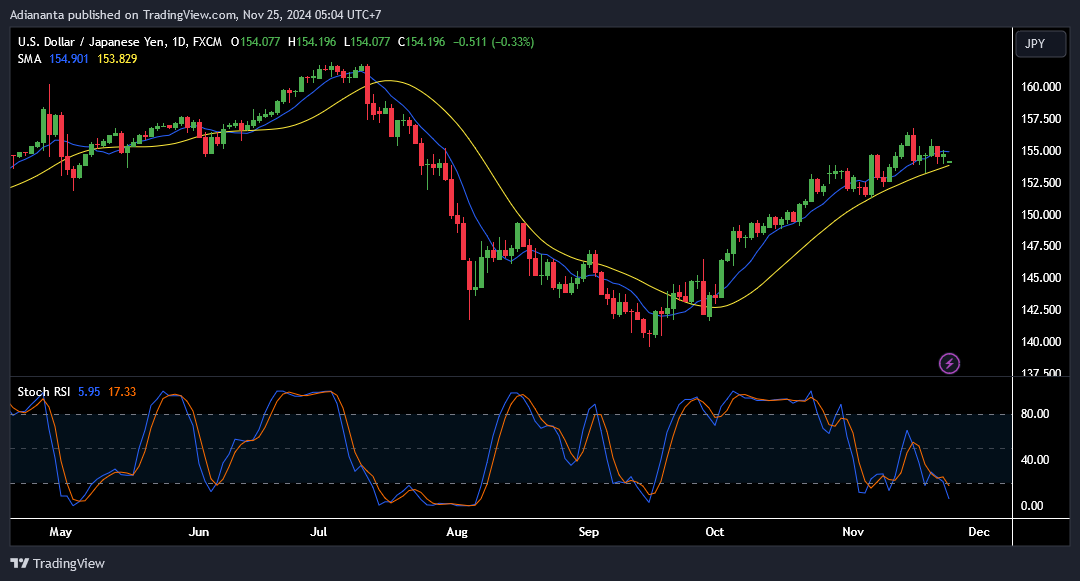
On the Daily chart, USD/JPY is in a pullback phase following a prior bullish trend.
Trend
- Status: Slowing uptrend
The price remains above the SMA-50 but is showing signs of weakening momentum.
Support and Resistance
- Key resistance: 155.500
- Key support: 152.500
The 152.500 support level is critical for maintaining the long-term uptrend.
Technical Indicators
- SMA (Simple Moving Average):
The SMA-50 and SMA-100 continue to support the bullish trend, but the gap between them is narrowing. - Stochastic RSI:
The indicator shows oversold levels (5.95 and 17.33), indicating a potential upward reversal if the price holds above support.
Read more: Technical Analysis of EUR/USD This Week: Bearish Potential!
USD/JPY Weekly Analysis
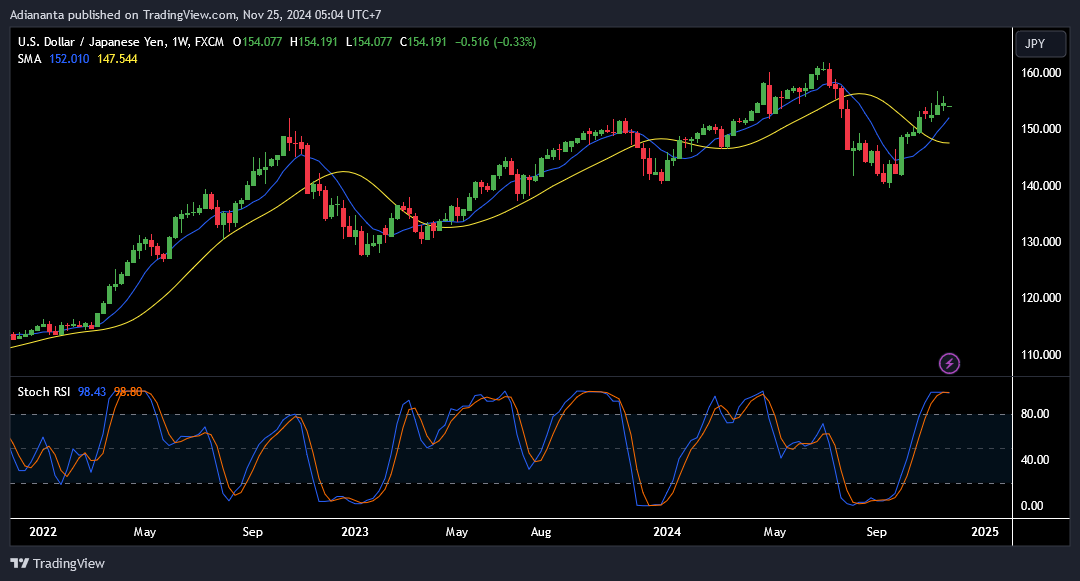
On the Weekly timeframe, USD/JPY maintains a long-term bullish trend, despite minor corrections.
Trend
- Status: Bullish
The corrections remain healthy as the price stays above the SMA-50 and SMA-100.
Support and Resistance
- Key resistance: 160.000
- Key support: 150.000
The 150.000 support level is a crucial threshold for the continuation of the bullish trend.
Technical Indicators
- SMA (Simple Moving Average):
The SMA-14 and SMA-50 indicate a stable upward trend. - Stochastic RSI:
The indicator is in the overbought region (98.43 and 98.80), signaling a potential correction if the price fails to break above resistance.
Read more: Risk Management in Forex Trading
Predictions
Based on the analysis:
- Short-term (H4): The price is likely to move sideways between 153.800-155.200, with breakout potential if strong momentum appears.
- Medium-term (Daily): A pullback to the 152.500 support level is possible before resuming the bullish trend.
- Long-term (Weekly): The bullish trend remains dominant, but a correction toward 150.000 may occur under significant selling pressure.
Trading Suggestions
- Entry point: Buy near the 152.500 support level or on a breakout above 155.500.
- Take profit (TP): 156.500 for the short term and 160.000 for the long term.
- Stop loss (SL): 151.500 to protect against moves below the key support level.
Reasoning:
The 152.500 support level is a strategic area based on the Daily analysis. Additionally, the Stochastic RSI in the oversold region suggests a potential price reversal.
Read: How to identify support and resistance
Join the TDS Community!
Get comprehensive technical analysis like this every week by joining the TDS Community, a trading community dedicated to helping traders achieve success. We offer copy trading from top traders on MQL5 for free, with no subscription fees or VPS costs. Join now and enjoy safe trading with us!
![]()


