

Introduction
The USD/JPY currency pair shows signs of weakening across multiple timeframes. Data from the charts indicate bearish pressure amid the loss of previous bullish momentum. In this article, we will analyze price movements based on the H1, H4, and Daily timeframes to provide predictions and relevant trading suggestions.
USD/JPY Analysis on H1 Timeframe
Trend
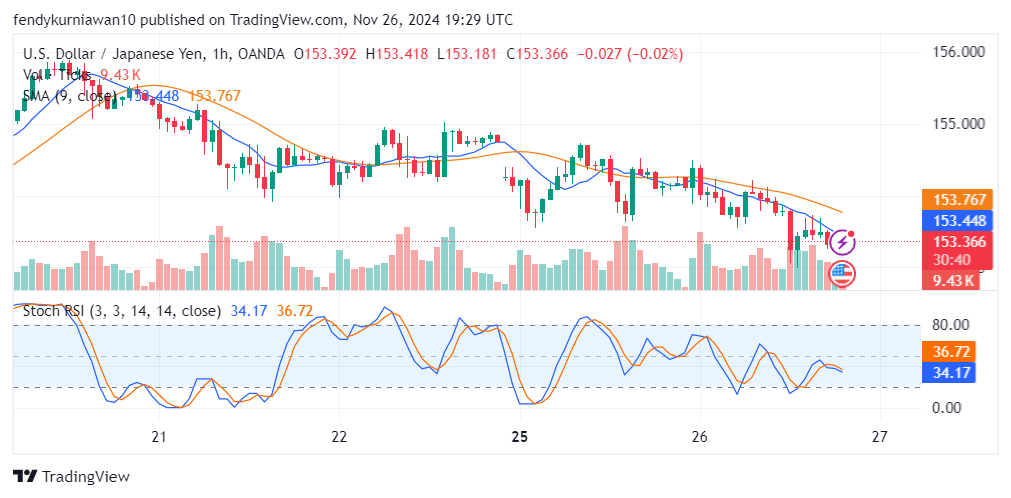
On the H1 timeframe, USD/JPY is in a bearish trend, with a gradual price decline. The price is currently trading below the Simple Moving Average (SMA) 9, highlighting sellers’ dominance in the short term.
Support and Resistance
- Nearest Support: 153.350
- Nearest Resistance: 153.767
Technical Indicators
- The Stochastic RSI shows oversold conditions at around 34.17, indicating a potential minor correction before continuing the downtrend.
USD/JPY Analysis on H4 Timeframe
Trend
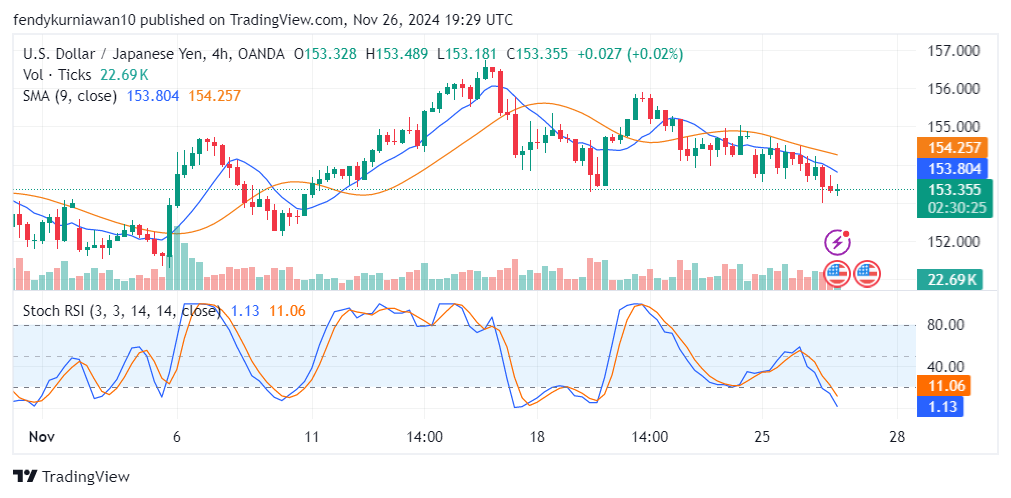
The H4 timeframe displays a consistent downtrend, with candlesticks breaking below SMA 9. This indicates strong selling pressure, overshadowing any potential rebound.
Support and Resistance
- Major Support: 153.355
- Major Resistance: 154.257
Technical Indicators
- The Stochastic RSI in the oversold area around 11.06 suggests further downside potential if the price fails to breach significant resistance levels.
USD/JPY Analysis on Daily Timeframe
Trend
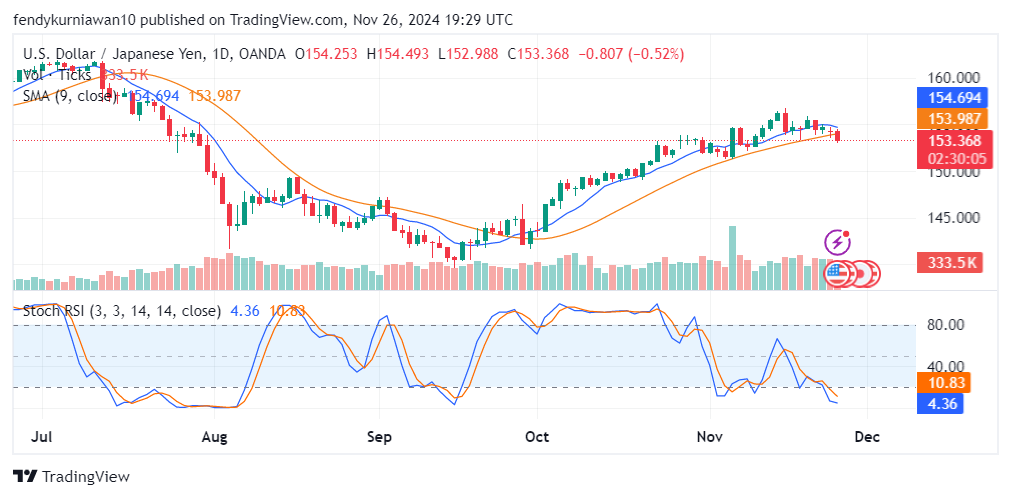
On the Daily timeframe, USD/JPY is losing its long-term bullish momentum. Daily candlesticks are nearing the SMA 9, signaling a possible bearish reversal if key support levels are broken.
Support and Resistance
- Key Support: 153.368
- Key Resistance: 153.987
Read: How to identify support and resistance
Technical Indicators
- The Stochastic RSI is in the oversold zone (4.36), pointing to continued weakness or price consolidation near support levels.
Price Movement Prediction
Based on the analysis:
- Short-term: The price is likely to test support at 153.350 on the H1 timeframe.
- Medium-term: If support at 153.355 (H4) is broken, the price could continue dropping toward the 152.800 area.
- Long-term: The Daily timeframe indicates further downside potential, but confirmation of a break below the key support at 153.368 is needed.
Trading Recommendations
Suggestion
- Sell USD/JPY
- Entry Point: 153.400
- Take Profit (TP): 152.800
- Stop Loss (SL): 153.800
Reasons
- Bearish pressure is evident across all timeframes.
- The Stochastic RSI in oversold areas suggests the continuation of the bearish trend.
- SMA 9 acting as a dynamic resistance confirms sellers’ control over the market.
Join TDS Community
Enhance your trading experience by joining the TDS Community! Take advantage of free copy trading with access to top traders on MQL5, without subscription fees or VPS rental costs. Join now and elevate your trading journey with TDS Copytrade.
![]()


