

The USD/JPY pair is showing interesting dynamics across multiple timeframes. This article will dive into technical analysis, price movement predictions, and trading recommendations for you. Focusing on support, resistance, and technical indicator signals, let’s explore the current market potential.
USD/JPY analysis on the Daily timeframe
Trend
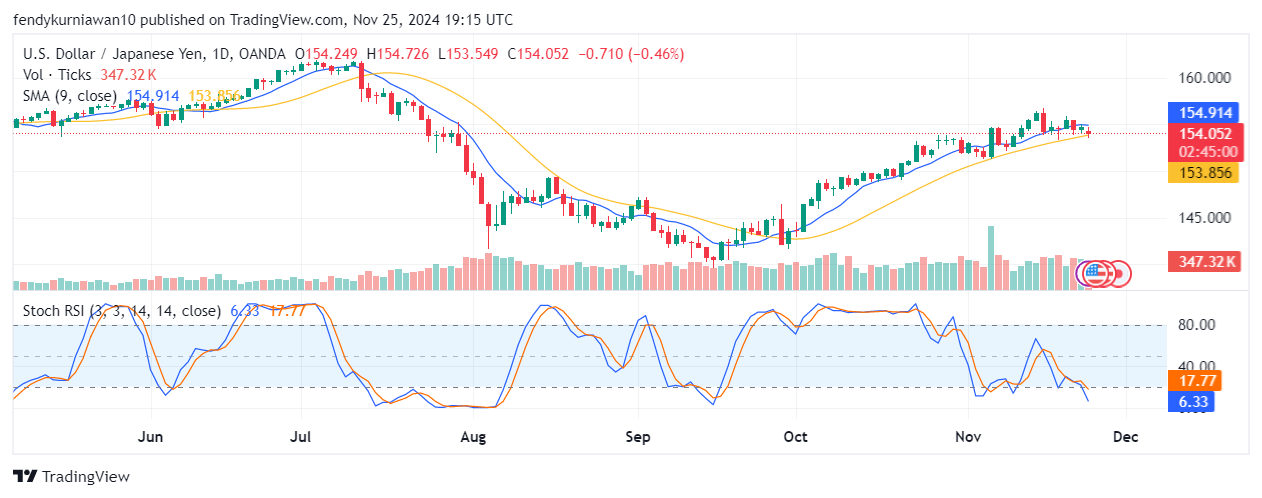
On the Daily timeframe, the price is in a consolidation phase after a strong uptrend in the previous month. Currently, the price hovers near the 9-period Simple Moving Average (SMA) at around 154.914. While the primary trend remains bullish, the upward momentum appears to be weakening.
Support and resistance
- Key resistance: 155.726, the recent high.
- Key support: 153.856, a level tested several times before.
Technical indicators
- Stochastic RSI: Positioned in the oversold area (6.33), indicating a potential rebound or upward correction in the near term.
- Volume: A decline in volume shows weakening market momentum.
USD/JPY analysis on the H4 timeframe
Trend
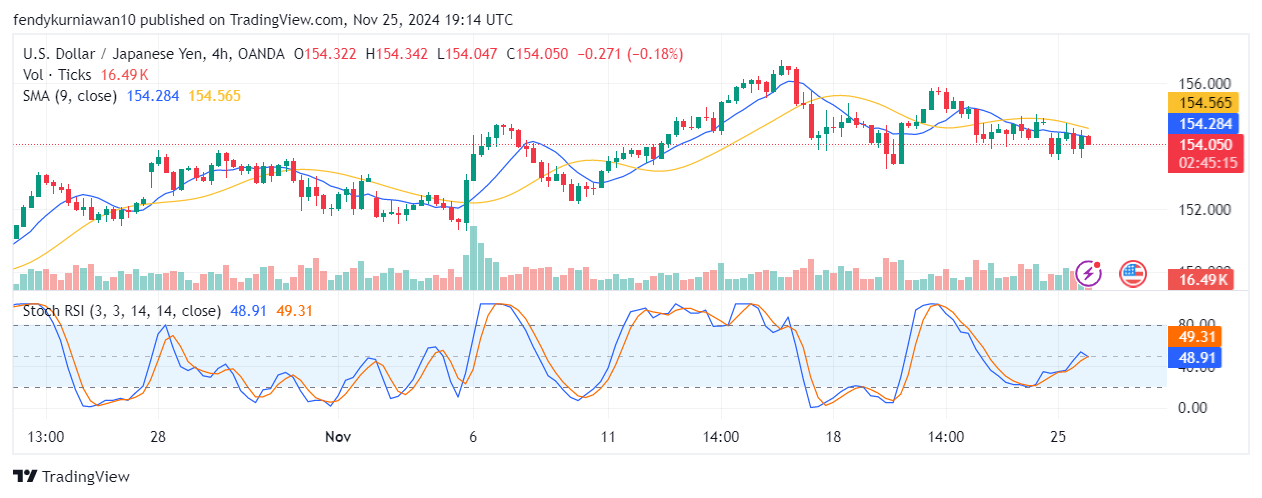
On the H4 timeframe, the price is in a sideways phase with a slightly bearish bias. The 9-period SMA (154.565) acts as a dynamic resistance, keeping the price below this level.
Support and resistance
- Key resistance: 154.565.
- Key support: 153.500, a critical level that could trigger further downside if broken.
Technical indicators
- Stochastic RSI: Hovering near the neutral zone (48.91 and 49.31), indicating that the market is awaiting a directional confirmation.
- Volume: Relatively stable compared to the Daily timeframe, signaling consolidation at this level.
USD/JPY analysis on the H1 timeframe
Trend
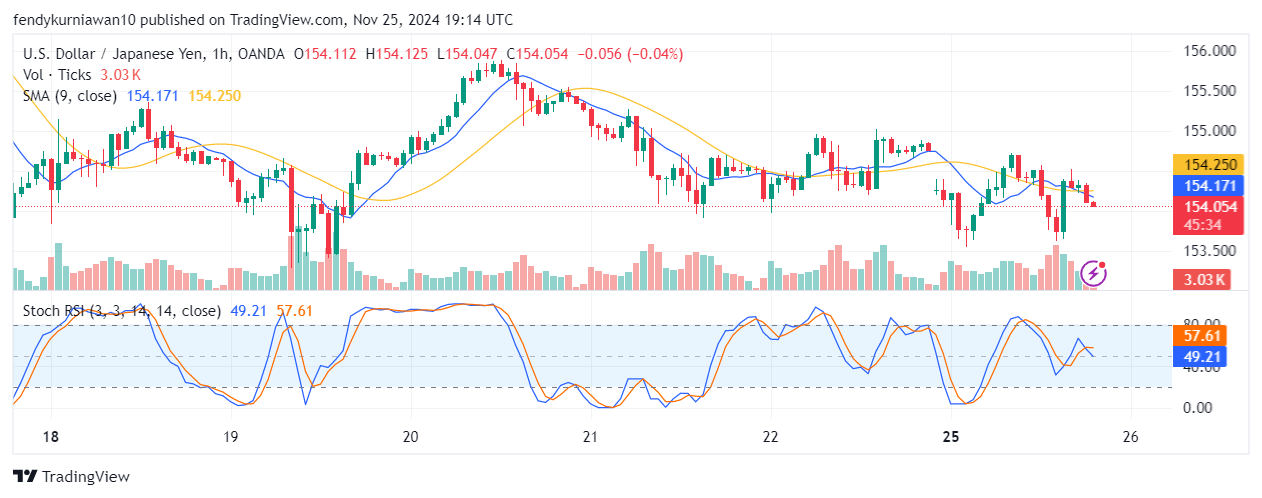
On the H1 timeframe, USD/JPY is in a short-term consolidation pattern with a bearish bias. The 9-period SMA (154.171) serves as a significant dynamic resistance, with the price failing to break above this level.
Support and resistance
- Key resistance: 154.250, aligning with the 9-period SMA.
- Key support: 153.900, a level to watch for potential breakdowns.
Read: How to identify support and resistance
Technical indicators
- Stochastic RSI: Positioned in the overbought zone (57.61), suggesting potential downward correction.
- Volume: Declining trading volume confirms a lack of momentum.
USD/JPY predictions
Based on the analysis across all timeframes:
- Short-term: The price is likely to move sideways with a potential dip toward the 153.900 support area.
- Mid-term: If the 153.500 support is broken, USD/JPY may head toward the 152.800 level.
- Long-term: As long as the price stays above 153.500, the long-term bullish trend remains valid.
Trading recommendations
- Entry point: Wait for confirmation at the 153.900 level. If the price bounces, go for a buy position. If it breaks below, look for sell opportunities.
- Buy setup:
- Entry: 154.000.
- TP: 155.500.
- SL: 153.700.
- Sell setup:
- Entry: 153.800.
- TP: 153.000.
- SL: 154.200.
These recommendations are based on technical indicators and key support/resistance levels.
Join the TDS Community!
Looking for safe and efficient trading? TDS Community is your best choice! We provide free copy trading services from top traders on MQL5, with no subscription fees and no VPS rental costs. Join now and seize the opportunity to achieve consistent profits with our community!
![]()


