

The XAU/USD pair (gold versus the US dollar) continues to captivate the trading world with its compelling price movements. As of December 4, 2024, gold prices are consolidating within a narrow range, reflecting mixed market sentiment. The long-term trend remains bullish, supported by favorable macroeconomic conditions and ongoing geopolitical tensions that sustain gold’s role as a safe-haven asset.
This article delves into the technical analysis of XAU/USD across Daily, 4-Hour, and 1-Hour timeframes. We examine price trends, support and resistance levels, and key technical indicators to provide actionable predictions and trading advice. Whether you’re a day trader or long-term investor, this comprehensive analysis will enhance your strategy for trading gold.
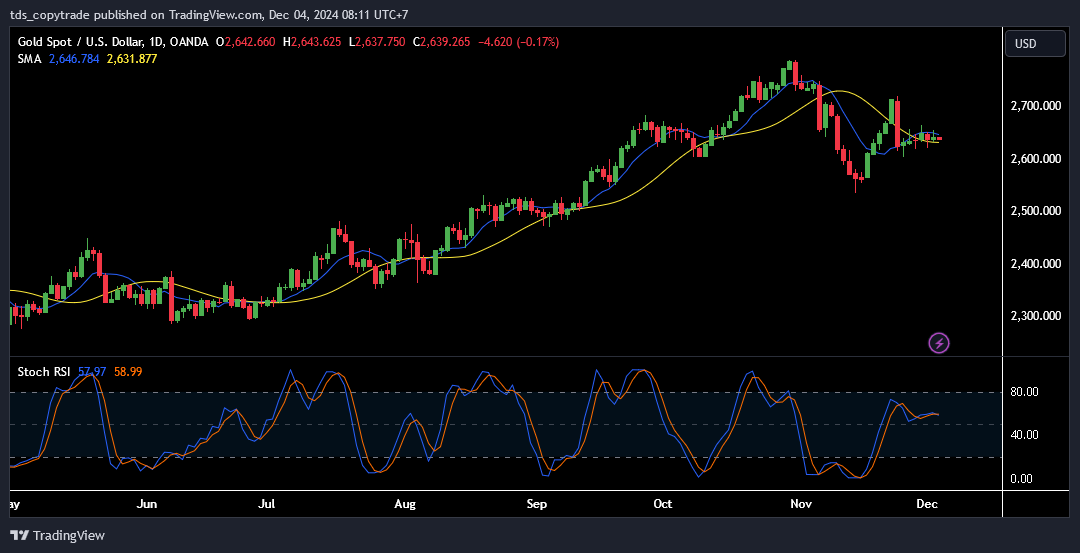
XAU/USD Daily Analysis
Trend: Uptrend in Pause Mode
The daily chart shows a clear long-term uptrend, although momentum has slowed in recent weeks. The 50-day Simple Moving Average (SMA) remains above the 200-day SMA, forming a golden cross pattern earlier this year. This technical signal confirms the bullish trend, even as prices consolidate around the $2,640-$2,700 range.
However, price action is currently testing the 50-day SMA ($2,646.78), signaling potential indecision among market participants. A decisive close below this level could attract more sellers in the short term.
Support and Resistance Levels
- Key Resistance: The $2,700 mark remains the primary resistance level. This psychological level has acted as a ceiling for prices multiple times over the past month.
- Primary Support: Immediate support is at $2,600, where the 50-day SMA aligns with historical buying pressure. A break below this level could open the door to $2,500, the next major support.
Read: How to identify support and resistance
Stochastic RSI Analysis
The Stochastic RSI on the daily chart is at 58.99, placing it in the neutral zone. This suggests that momentum could swing in either direction depending on upcoming price action. Historically, a reading near 60 often precedes a move toward overbought levels, reinforcing the potential for further upside if $2,700 is breached.
Educational Insight: SMA and Stochastic RSI
The Simple Moving Average (SMA) is a widely used trend indicator. A rising SMA signals an uptrend, while a falling SMA indicates bearish momentum. The Stochastic RSI, on the other hand, measures overbought and oversold conditions. Combining these tools helps traders confirm trends and identify potential reversals.
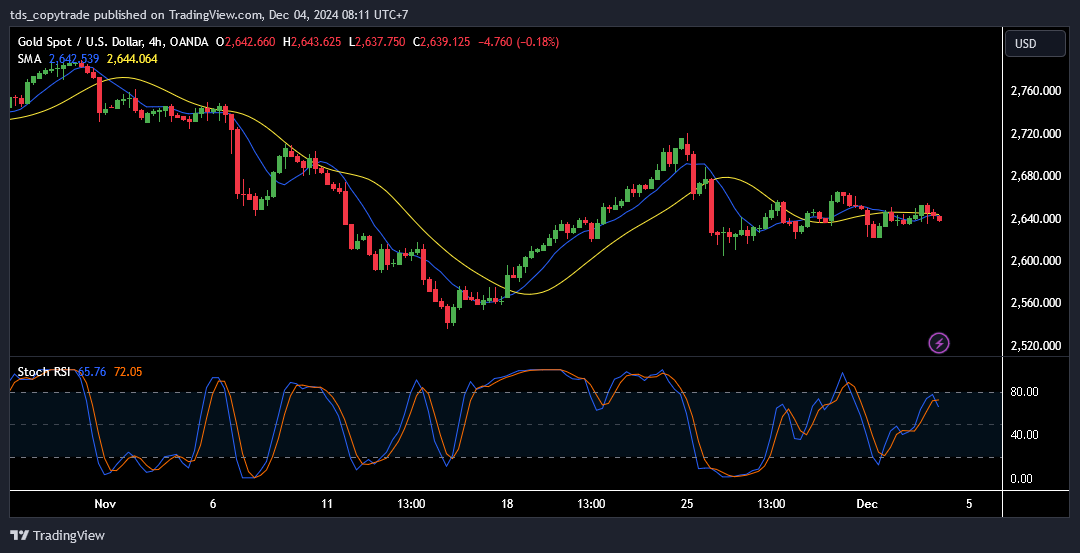
XAU/USD 4-Hour Analysis
Trend: Consolidation
The 4-hour chart highlights a sideways consolidation phase, with prices oscillating between $2,620 and $2,650. This range-bound behavior indicates market indecision, as traders await a catalyst to drive the next significant move. The 50-period SMA and 200-period SMA are converging, further emphasizing the lack of a clear trend.
Support and Resistance
- Immediate Resistance: $2,650 has acted as a cap for recent upward attempts. A break above this level would pave the way for a retest of $2,700.
- Key Support: $2,620 is the first line of defense, with $2,600 providing a stronger safety net.
Stochastic RSI Analysis
At 72.05, the Stochastic RSI is firmly in the overbought zone on the 4-hour chart. This signals a high probability of a short-term pullback, especially if the price fails to break above $2,650. Traders should be cautious of entering long positions until a correction occurs.
Potential Breakout Setup
If gold breaks above $2,650 with strong volume, traders should watch for follow-through buying toward $2,700. Conversely, a breakdown below $2,620 could signal a retest of $2,600, offering a buying opportunity for swing traders.
Read more: The Secret to Trading XAU/USD Without Margin Calls!
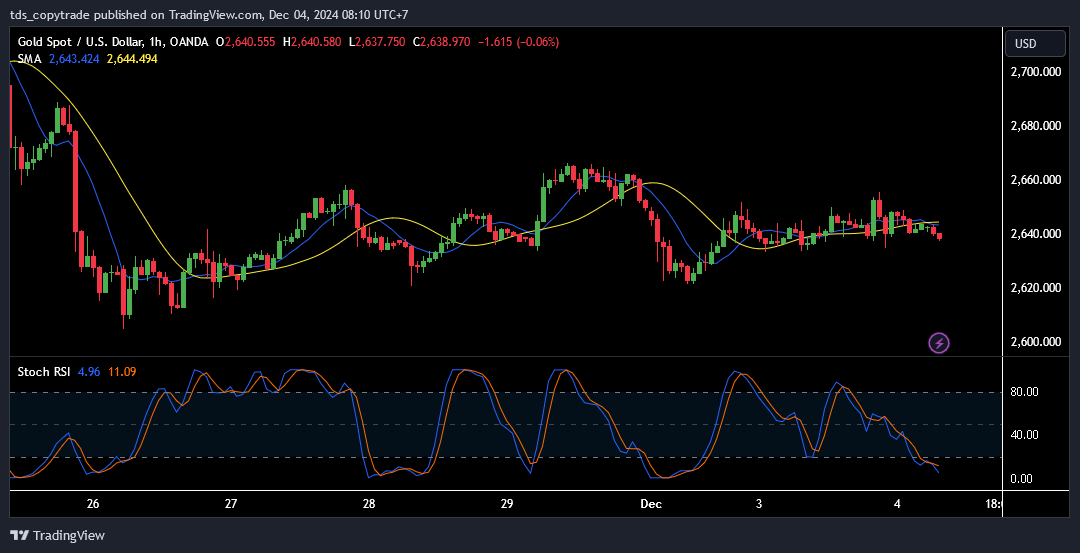
XAU/USD 1-Hour Analysis
Trend: Short-Term Bearish Pressure
The 1-hour chart shows signs of short-term bearish pressure, with prices trading below the 50-SMA. This indicates that sellers have gained control in the immediate timeframe, even as the broader consolidation zone ($2,630-$2,650) remains intact.
Support and Resistance
- Resistance: $2,645 is the nearest resistance level, with $2,650 offering stronger resistance above.
- Support: $2,635 provides immediate support, while $2,620 remains a crucial level to monitor.
Stochastic RSI Analysis
The Stochastic RSI on the 1-hour chart is at 11.09, signaling an oversold condition. This suggests that a short-term bounce could be imminent, particularly if prices hold above $2,635. Traders should look for bullish confirmation signals, such as a crossover of the Stochastic RSI lines or a break above the 50-SMA.
Prediction: What to Expect Next
Based on the analysis of these timeframes:
- Short-Term Prediction: Gold is likely to retest the $2,645-$2,650 resistance zone in the coming sessions. If the Stochastic RSI on the 1-hour chart continues to recover, prices could break above $2,650.
- Medium-Term Prediction: Consolidation is expected to continue on the 4-hour chart unless a significant news event triggers a breakout. A decisive move above $2,650 would target $2,700, while a breakdown below $2,620 would expose $2,600.
- Long-Term Prediction: The bullish trend on the daily chart remains intact as long as $2,600 holds. A breakout above $2,700 would confirm the resumption of the uptrend, with potential upside targets of $2,750 and $2,800.
Trading Advice: How to Trade XAU/USD
Buy Setup
- Entry Point: $2,635 after confirmation of oversold conditions on the 1-hour chart.
- Take Profit (TP): $2,645 for short-term gains; $2,700 for medium-term targets.
- Stop Loss (SL): $2,620 to limit downside risk.
Sell Setup
- Entry Point: $2,645 if price action shows rejection of resistance.
- Take Profit (TP): $2,620 for short-term gains.
- Stop Loss (SL): $2,660 to manage risk.
Read more:
Reasons for This Strategy
- The oversold Stochastic RSI on the 1-hour chart supports a potential bounce, favoring a buy entry at $2,635.
- The resistance at $2,645 provides an opportunity for counter-trend traders to short if prices fail to break higher.
- Risk management remains crucial, with tight stop losses recommended to navigate consolidation.
Broader Market Sentiment
Gold’s consolidation reflects broader market uncertainty. Investors are weighing geopolitical risks, fluctuating bond yields, and a mixed US dollar outlook. Safe-haven demand continues to underpin gold prices, while profit-taking near $2,700 caps gains. Traders should monitor key economic events, such as US labor data or central bank announcements, for clues about gold’s next move.
Join the TDS Community Today!
Ready to elevate your trading game? Join the TDS Community now and gain access to expert insights, free copy trading facilities, and zero VPS rental fees. Our top traders on MQL5 make trading safe, secure, and profitable. Don’t miss the chance to trade smarter—join the TDS Community today!
![]()


