Gold (XAU/USD) is trading in a consolidation phase near critical levels, reflecting a tug-of-war between buyers and sellers. The current price action indicates uncertainty, with the market awaiting a decisive breakout to establish a clear direction.
In this article, we analyze the XAU/USD price movements across hourly, 4-hour, and daily timeframes. This comprehensive breakdown covers; trends, key support and resistance levels, technical indicators, and actionable predictions, to help traders make informed decisions.
Gold remains a popular asset for traders, especially during uncertain economic times. By evaluating the current chart patterns and technical setups, we provide detailed predictions and trading recommendations to capitalize on potential market moves.
Read more: XAU/USD This Week: December Trading Insights
XAU/USD Hourly Analysis
Trend
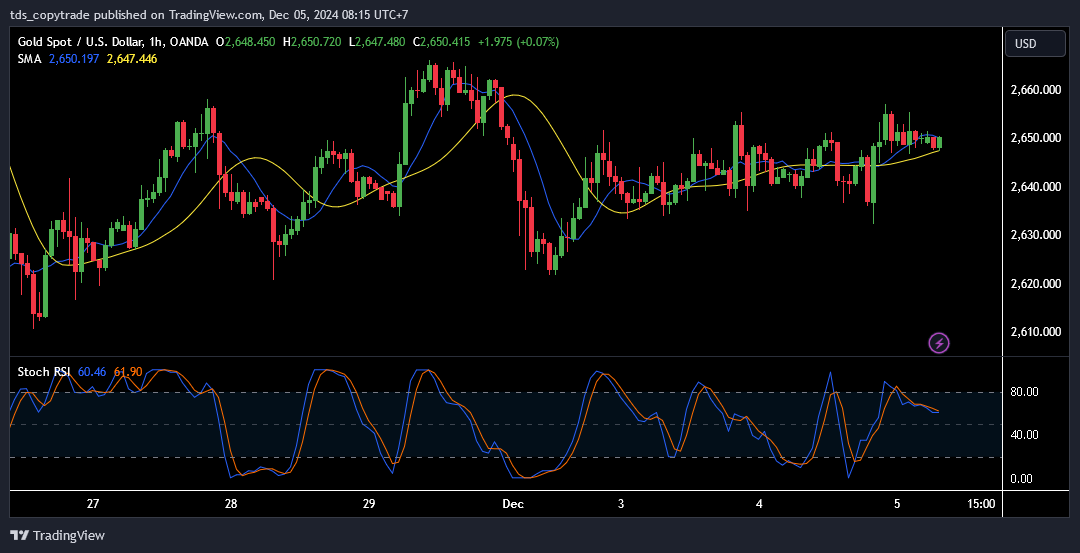
The 1-hour chart shows a sideways trend, with prices consolidating between $2,647 and $2,652. The convergence of the SMA (20) and SMA (50) highlights reduced volatility, signaling a lack of directional bias. Small-bodied candlesticks dominate the chart, underscoring the current indecision in the market.

Support and Resistance
- Immediate Support: $2,647 – This level has been tested repeatedly and remains a critical barrier for bears.
- Immediate Resistance: $2,652 – Buyers have struggled to break above this level, which now acts as a cap on upward momentum.
The tight trading range suggests that traders are waiting for a catalyst to trigger a breakout. A close above $2,652 could push prices toward the next resistance at $2,660.
Indicators
- Stochastic RSI: With a reading of 60, the oscillator indicates mild bullish momentum. However, the flattening curve signals waning strength.
- Moving Averages: Both SMA (20) and SMA (50) are nearly flat, reflecting the lack of a strong trend.
XAU/USD 4-Hour Analysis
Trend
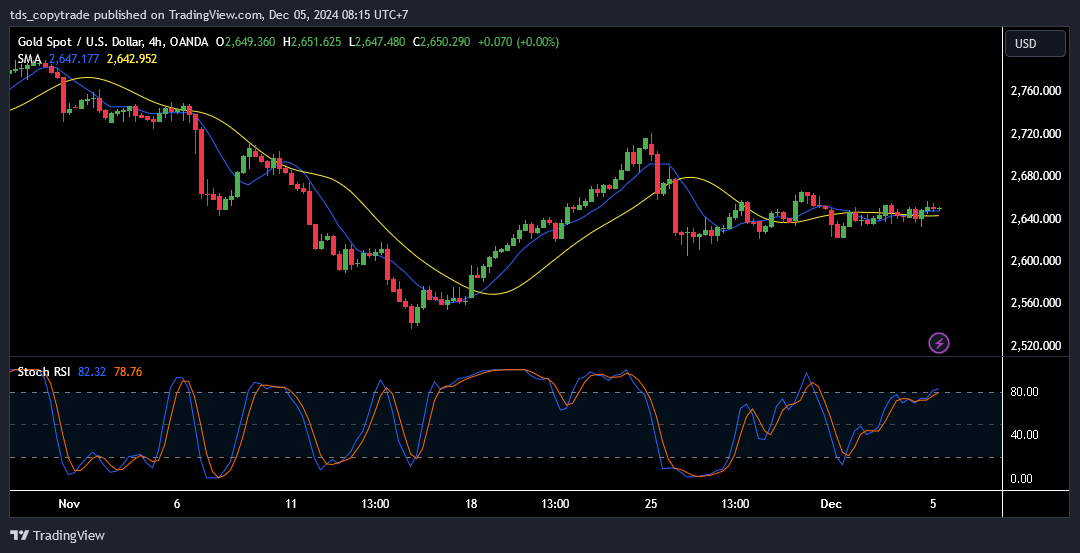
The 4-hour chart paints a picture of a market recovering from a prior downtrend. The upward crossover of the SMA (20) over the SMA (50) suggests medium-term bullish potential. However, the failure to break above the $2,660 resistance indicates a pause in bullish momentum.

Support and Resistance
- Key Support: $2,642 – This level has consistently provided a strong base for buyers.
- Resistance Levels:
- $2,660 – Immediate resistance that has capped upward moves.
- $2,680 – A critical target for bulls if $2,660 is breached.
Read more: The Secret to Trading XAU/USD Without Margin Calls!
The price action suggests that $2,642 will remain a key area of interest for buyers. However, the overbought conditions on the Stochastic RSI warn of a potential pullback.
Indicators
- Stochastic RSI: The oscillator is in the overbought zone at 82, signaling that buyers may be losing steam. A pullback toward $2,642 is likely before any further upward movement.
- SMA Crossover: The bullish crossover of SMA (20) above SMA (50) reinforces medium-term upside potential.
XAU/USD Daily Analysis
Trend
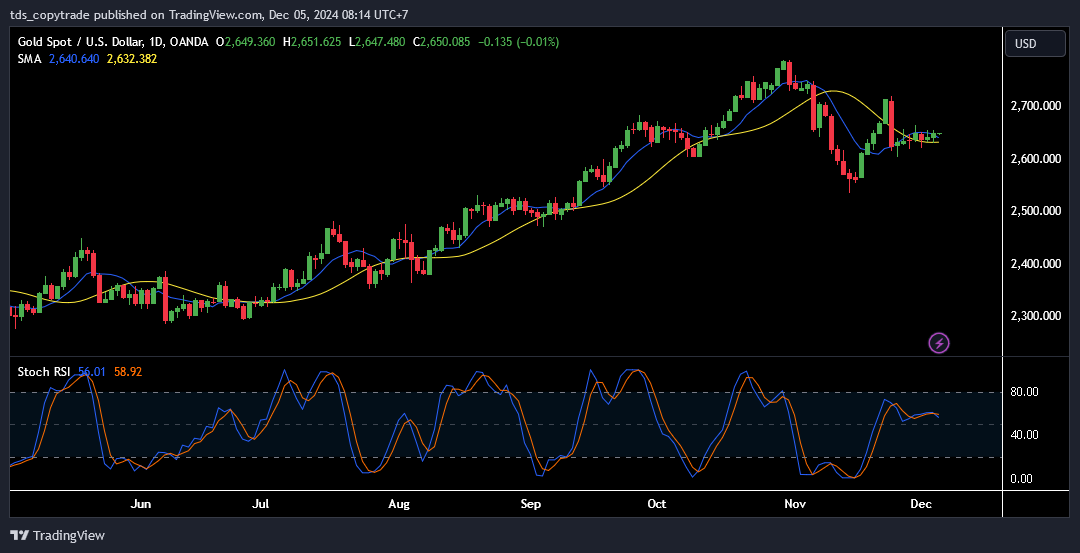
The daily chart maintains a bullish structure, with the SMA (50) acting as dynamic support. Despite recent consolidation, the upward slope of the SMA (50) confirms the longer-term uptrend. However, the current price action reflects hesitation, as traders assess the next direction.

Support and Resistance
- Major Support: $2,630 – This level has been a consistent floor for prices during previous corrections.
- Major Resistance: $2,700 – A key psychological barrier that needs to be cleared for the uptrend to continue.
Read: How to identify support and resistance
The consolidation around $2,650 suggests that the market is in a pause phase, likely waiting for a fundamental trigger to dictate the next move.
Indicators
- Stochastic RSI: With a reading of 58, the oscillator indicates neutral momentum. The lack of overbought or oversold conditions reflects the current market indecision.
- Moving Averages: The SMA (50) continues to rise, providing strong support and reinforcing the bullish bias.
Prediction
Short-Term (1-2 Days)
In the short term, XAU/USD is expected to remain range-bound between $2,647 and $2,652. A breakout above $2,652 could lead to a quick rally toward $2,660. On the downside, a break below $2,647 may target $2,642.
Medium-Term (1 Week)
Over the next week, if $2,642 holds as support, gold could test the $2,680 level. However, failure to hold above $2,642 could open the door for further downside toward $2,630.
Long-Term (1 Month)
In the longer term, the bullish trend remains intact. A breakout above $2,700 could signal the resumption of the uptrend, potentially targeting $2,750.
Trading Advice
Buy Scenario
- Entry Point: $2,647
- Take Profit (TP): $2,660
- Stop Loss (SL): $2,640
- Reason: The consolidation at $2,647 provides a low-risk entry point for buyers. The SMA alignment and potential breakout above $2,652 favor a bullish strategy.
Sell Scenario
- Entry Point: Below $2,647
- Take Profit (TP): $2,630
- Stop Loss (SL): $2,655
- Reason: A breakdown below $2,647 would confirm bearish momentum, targeting the next major support level at $2,630.
Read more:
Educational Insights
Stochastic RSI
The Stochastic RSI is a momentum indicator that measures overbought and oversold conditions. In this analysis, it highlights potential pullbacks or reversals, especially in the 4-hour and daily timeframes. Pairing the Stochastic RSI with support and resistance levels enhances its effectiveness.
Moving Averages (SMA)
Moving averages are essential tools for identifying trends and dynamic support/resistance zones. In this case, the SMA (50) on the daily chart reinforces the bullish trend, while the SMA crossover on the 4-hour chart signals medium-term upside potential.
Consolidation Patterns
Consolidation phases, like the one observed in XAU/USD, often precede breakouts. Traders should monitor volume spikes and candlestick patterns, such as engulfing candles, for clues about the breakout direction.
Join the TDS Community
Maximize your trading potential by joining the TDS Community. Enjoy free copy trading with top-performing traders on MQL5, with no subscription fees or VPS rental costs. Whether you’re new to trading or an experienced professional, TDS Copytrade offers a secure and profitable way to grow your portfolio. Click “Join Now” button below today, and to take control of your financial future with the support of a thriving community.


