Gold (XAU/USD) is currently trading near $2,633 as the market navigates a critical phase of consolidation and potential breakout. Across multiple timeframes—weekly, daily, and 4-hour—the price action reveals compelling trends that are shaped by both technical indicators and broader economic sentiment. This analysis explores the key levels, trends, and potential scenarios to help traders position themselves effectively.
Read more: XAU/USD This Week: December Trading Insights
XAU/USD Weekly Analysis
Trend
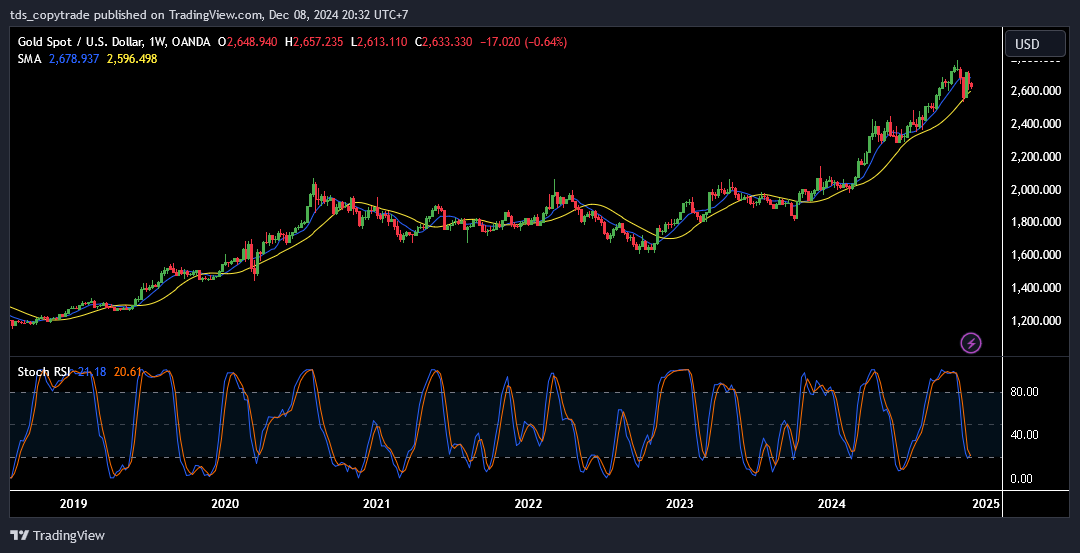
The weekly chart depicts a strong long-term uptrend, as evidenced by the sustained position of prices above the 50-period Simple Moving Average (SMA). However, the recent candlestick patterns suggest potential exhaustion in the bullish momentum. The market seems to be pausing after a robust rally earlier this year.

Support and Resistance
- Support Levels:
- $2,596: Long-term SMA acting as dynamic support.
- $2,400: Key horizontal support aligned with prior consolidations.
- Resistance Levels:
- $2,657: Current weekly high serving as immediate resistance.
- $2,700: Significant psychological and technical barrier.
Read: How to identify support and resistance
Indicators
The Stochastic RSI is trending downward, near the oversold region (20.61). This signals a potential bearish correction in the medium term, though the overall uptrend remains intact.
Key Observation
The weekly timeframe highlights a potential pullback or correction phase after sustained upward momentum. This could provide buying opportunities if key support zones hold.
XAU/USD Daily Analysis
Trend
On the daily chart, XAU/USD is consolidating after a short-term retracement. While the 50-day SMA at $2,639 provides nearby resistance, the price action is currently respecting the upward trajectory of the 200-day SMA.

Support and Resistance
- Support Levels:
- $2,633: Immediate support based on recent price action.
- $2,600: Next major support level with confluence from the 200-day SMA.
- Resistance Levels:
- $2,645: Immediate resistance based on the SMA and local highs.
- $2,680: Higher resistance level that may limit bullish momentum.
Indicators
The Stochastic RSI shows values around 31.78, reflecting neutral momentum but leaning toward oversold. This suggests that a potential bounce could occur if buyers step in near the current support zone.
Key Observation
The daily chart reflects a consolidation phase, which is crucial for traders to monitor as it could lead to either a breakout above $2,645 or a breakdown toward $2,600.
XAU/USD 4-Hour Analysis
Trend
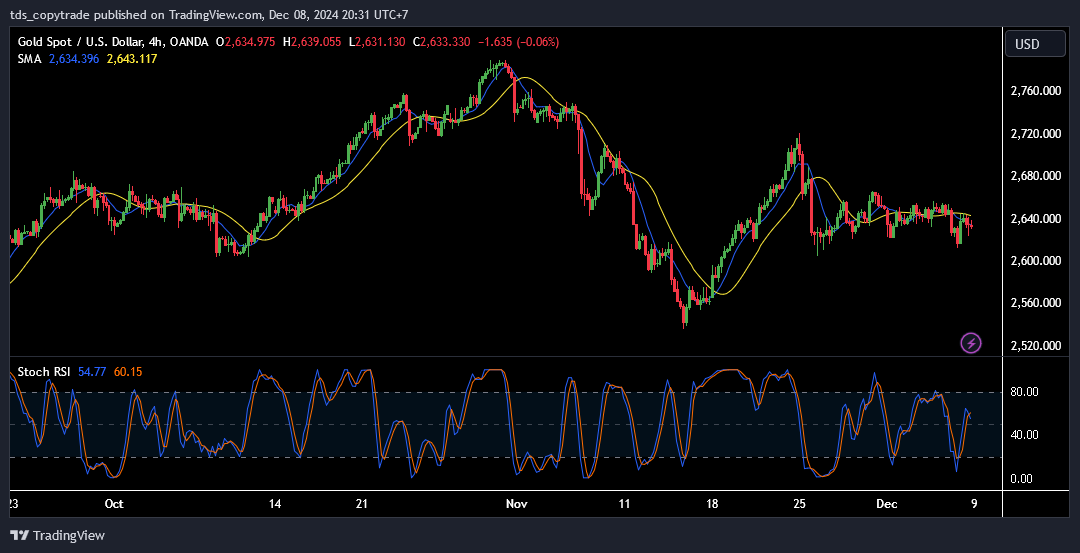
The 4-hour timeframe reveals a sideways trend as XAU/USD struggles to break past resistance at $2,645. The price remains sandwiched between the 50-SMA and 21-SMA, signaling indecision in the short term.

Support and Resistance
- Support Levels:
- $2,631: Recent local low providing short-term support.
- $2,600: Major psychological support to watch.
- Resistance Levels:
- $2,639: Confluence of 50-SMA and prior highs acting as immediate resistance.
- $2,645: Strong resistance level that aligns with previous peaks.
Indicators
The Stochastic RSI on this timeframe has crossed into overbought territory (54.77), which could signal limited upside in the near term. Traders should watch for potential pullbacks if this overbought condition persists.
Key Observation
The 4-hour chart provides short-term traders with a clear range-bound setup. Breakouts or breakdowns beyond these levels will define the next trend.
Prediction: Navigating Key Scenarios
Short-Term Outlook (1-7 Days)
- If resistance at $2,645 breaks, XAU/USD may rally toward $2,680.
- Conversely, a breakdown below $2,631 could see prices revisiting the $2,600 zone.
Long-Term Outlook (1 Month+)
Gold’s long-term uptrend remains intact, and prices are likely to retest the $2,700 mark in the coming weeks. However, failure to hold above $2,596 on the weekly chart could trigger deeper corrections.
Trading Advice
Buy Setup
- Entry Point: $2,633 (on confirmation of a bounce from support).
- Take Profit (TP): $2,645 (conservative) or $2,680 (aggressive).
- Stop Loss (SL): $2,625 (below immediate support).
Sell Setup
- Entry Point: $2,645 (if resistance holds).
- Take Profit (TP): $2,631 or $2,600.
- Stop Loss (SL): $2,655 (above resistance).
Strategy Insights
- Short-term traders can capitalize on range-bound movements between $2,631 and $2,645.
- Swing traders should monitor the daily chart for potential breakouts, focusing on levels at $2,680 or $2,600.
Read more:
Educational Insight: Using Multiple Timeframes
When analyzing XAU/USD:
- Weekly charts reveal long-term trends and major support/resistance levels.
- Daily charts highlight medium-term consolidation or breakout opportunities.
- 4-hour charts provide clarity on short-term momentum and intraday setups.
This multi-timeframe approach helps traders align their strategies with broader market conditions.
Join Us Now!
Want to simplify your trading process? Join the TDS Community, where trading is both smarter and safer. Our platform offers free copy trading with top MQL5 traders, no subscription fees, and no VPS costs. Get the insights and tools you need to succeed in the markets. Click link below here today to start your journey toward profitable trading!


