

Gold prices (XAU/USD) have shown significant movements in recent days, with a clear weakening trend across several timeframes. This article will discuss technical analysis based on H1, H4, and Daily charts to provide a clear view of market direction and optimal trading strategies.
XAU/USD H1 Analysis
Trend
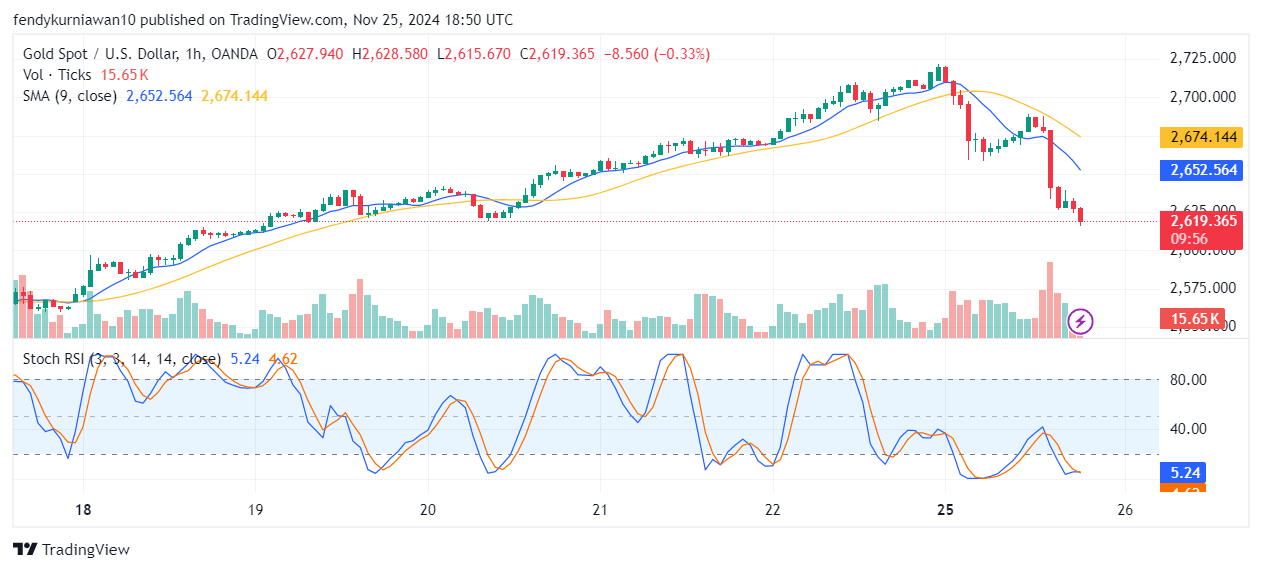
On the H1 timeframe, the price shows a clear downtrend. The decline is accompanied by a move below the 9-period moving averages (SMA and EMA), indicating strong bearish pressure.
Support and Resistance
- Resistance: $2,652.56 (based on the SMA 9).
- Support: $2,615.67, which is currently a critical area to watch.
Technical Indicators
- Stochastic RSI: The indicator is in the oversold zone (5.24), signaling a possible short-term rebound. However, this does not confirm a reversal without additional candlestick patterns.
H1 Conclusion
The likelihood of the price retesting resistance is low as long as bearish pressure persists. Beware of false breakouts around the support area.
XAU/USD H4 Analysis
Trend
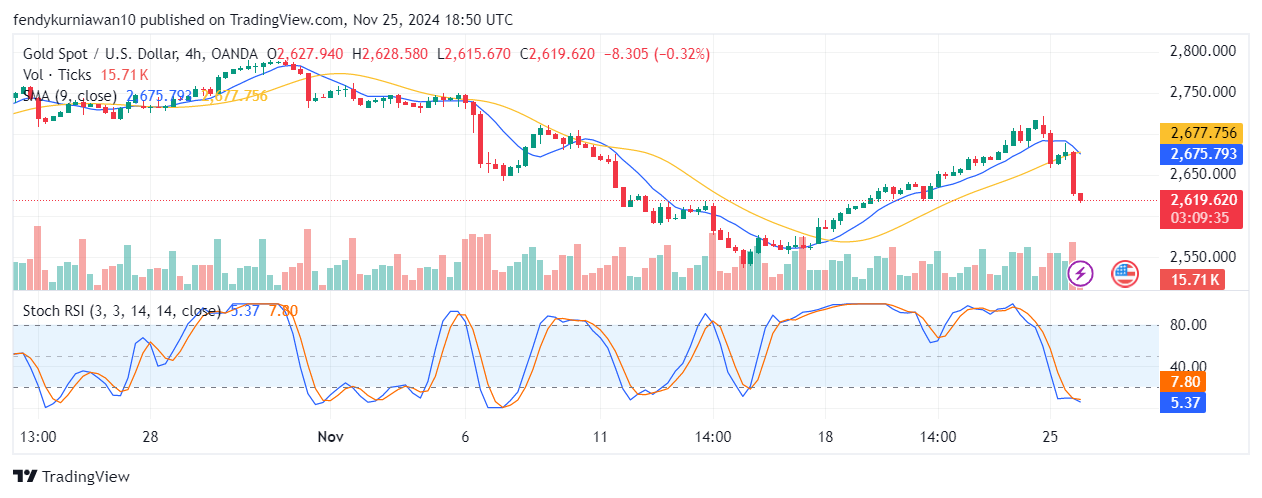
On the H4 timeframe, the price remains in a bearish phase with consistent declines below the 9-period SMA ($2,675.79). This moving average further supports the bearish bias as it trends downward.
Support and Resistance
- Resistance: $2,677.75.
- Support: $2,619.62.
Technical Indicators
- Stochastic RSI: The indicator stands at 7.80, also in the oversold zone. However, there is still room for further downside before buyers regain control.
H4 Conclusion
The price is likely to approach key support levels before any significant reversal signals emerge.
XAU/USD Daily Analysis
Trend
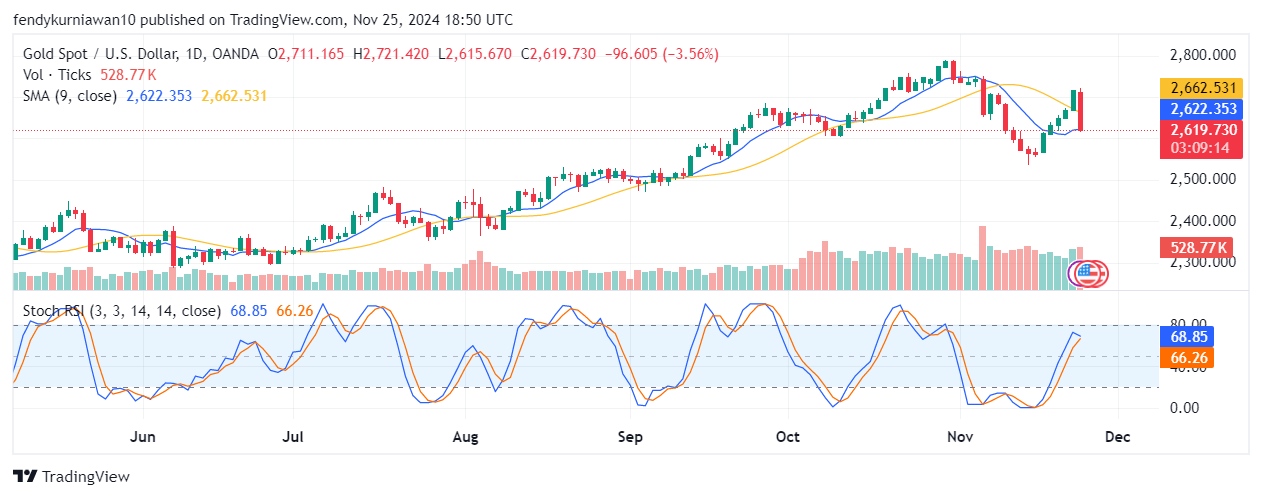
On the Daily timeframe, the price is experiencing a sharp retracement after peaking at $2,721.42. The 9-period SMA ($2,662.53) currently acts as a strong dynamic resistance.
Support and Resistance
- Resistance: $2,662.53.
- Support: $2,600.00, a crucial psychological level.
Read: How to identify support and resistance
Technical Indicators
- Stochastic RSI: Although nearing overbought levels at 66.26, this suggests that further correction remains possible.
Daily Conclusion
If bearish momentum continues, the price could test the strong support at $2,600. A break below this level would strengthen the medium-term bearish trend.
Price Movement Prediction
- Short-Term (H1 and H4): The price is expected to remain bearish, with a possibility of short-term correction. Monitor the $2,615 area for potential rebound signals.
- Long-Term (Daily): If bearish pressure persists, the price may test the $2,600 level. However, a reversal is possible if this support holds.
Trading Suggestions
Recommendation
- Position: Sell.
- Entry Point: $2,640.00 (based on a retest of resistance on the H1 and H4 timeframes).
- Take Profit (TP): $2,600.00.
- Stop Loss (SL): $2,660.00.
Reasoning
- Dominant bearish pressure across all timeframes.
- Technical indicators (Stochastic RSI) indicate oversold conditions but lack strong reversal signals.
- SMA 9 acts as a robust resistance on each timeframe.
Join the TDS Community Today!
Join TDS Community, a trading community dedicated to helping you achieve consistent profits through copy trading. Enjoy free subscription and zero VPS costs to copy strategies from top traders on MQL5. Be part of our community for safer, more focused trading!
Visit TDSCopyTrade.com today and start your trading journey. Trade safe, trade smart, and achieve the best results!
![]()


