

XAU/USD is showing an intriguing movement across multiple timeframes. This article dives into the technical analysis of this pair based on Daily, H4, and H1 charts. We will also provide price predictions and actionable trading advice to help you maximize your profit potential.
XAU/USD Daily Analysis
Trend
In the Daily timeframe, XAU/USD is in a bullish recovery phase after a recent correction. The price is now trading above the 20-day and 50-day Moving Averages (MA), signaling a shift back to an upward trend in the medium term.

Support and Resistance
- Key Support: $2,608
- Key Resistance: $2,680
Currently, the price is approaching the $2,680 resistance level and is likely to test this level in the coming days.
Technical Indicators
- Stochastic Oscillator is at level 56, recovering from the oversold zone, indicating growing bullish momentum.
- The 20-day MA is crossing above the 50-day MA, forming a bullish crossover.
XAU/USD H4 Analysis
Trend
On the H4 timeframe, XAU/USD exhibits a clearer uptrend. The price is steadily trading above the 20-day and 50-day MAs, with the MAs sloping upwards.
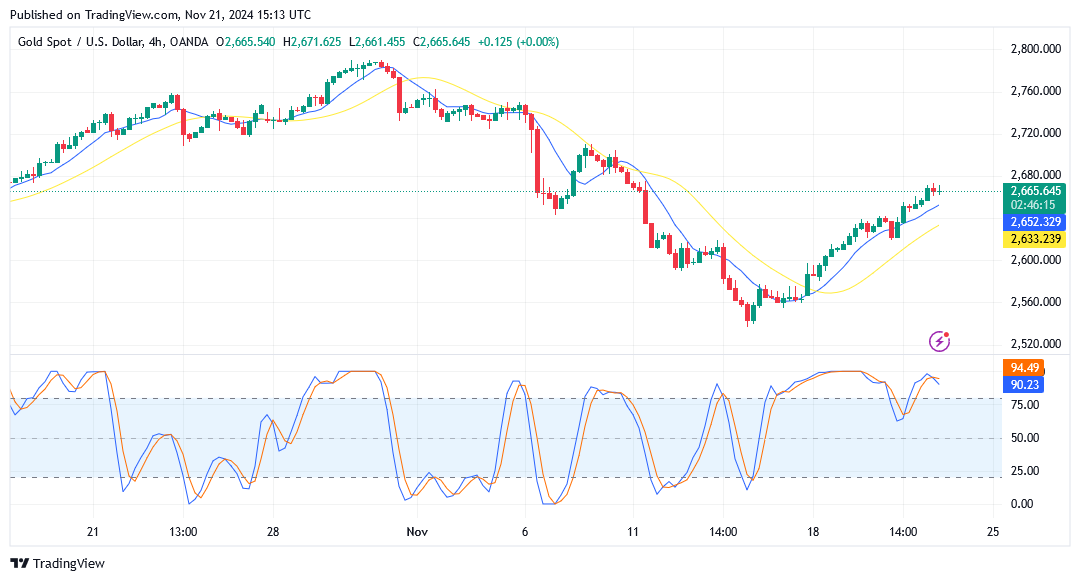
Support and Resistance
- Nearest Support: $2,652
- Next Resistance: $2,680
If the price breaks above $2,680, we can expect the bullish trend to continue toward $2,720.
Technical Indicators
- Stochastic Oscillator is at level 94, nearing the overbought zone. This suggests a potential minor correction before resuming the uptrend.
- The 20-day MA acts as a dynamic support level, cushioning the price from deeper corrections.
XAU/USD H1 Analysis
Trend
In the H1 timeframe, XAU/USD has seen a minor pullback after testing a short-term resistance level. However, the overall trend remains bullish, with the price staying above both the 20-day and 50-day MAs.
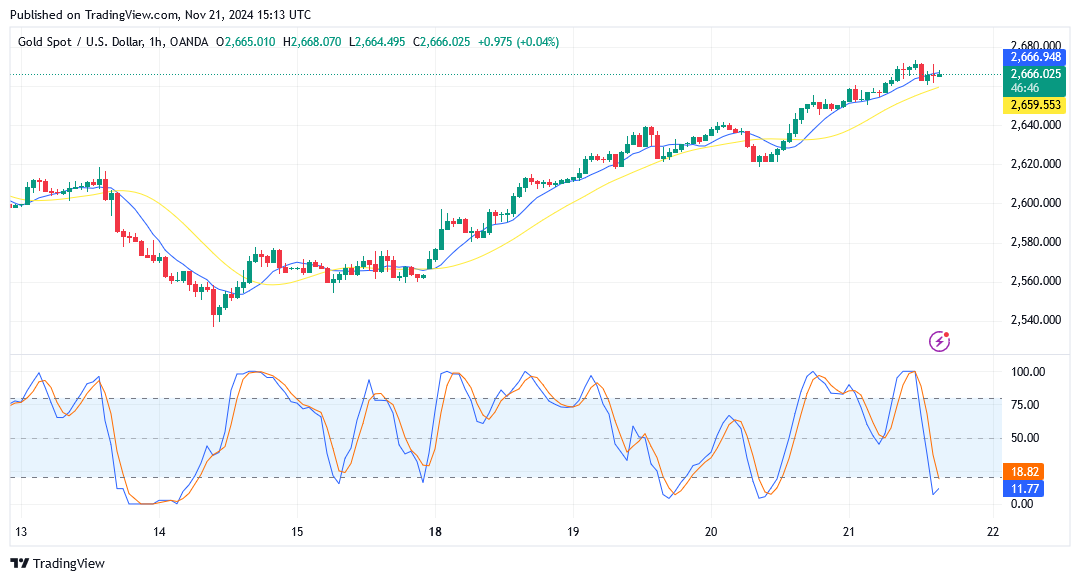
Support and Resistance
- Nearest Support: $2,659
- Next Resistance: $2,680
A minor pullback to $2,659 could offer a good buying opportunity.
Read: How to identify support and resistance
Technical Indicators
- Stochastic Oscillator is at level 18, indicating the price is in the oversold zone. This presents a potential for a bullish reversal soon.
- The 20-day MA shows a stable upward movement, supporting the bullish trend.
Price Predictions
Based on the technical analysis across all three timeframes:
- In the short term (H1), XAU/USD is likely to rebound from the $2,659 support level toward the $2,680 resistance level.
- For the medium term (H4), if the price successfully breaks above the $2,680 resistance, the next target is $2,720.
- Beside that, the long term (Daily), the bullish trend remains strong, with the next resistance target at $2,750.
Trading Recommendations
- Buy Limit: $2,659 (waiting for a correction to the H1 support)
- Take Profit (TP): $2,680 (short-term resistance) or $2,720 (medium-term resistance)
- Stop Loss (SL): $2,640 (below the dynamic support of the 20-day MA)
Why?
- Bullish momentum in the Daily and H4 timeframes supports a buy strategy.
- Stochastic Oscillator on H1 indicates oversold conditions, signaling a potential upward reversal.
- Moving Averages on all timeframes show a healthy and stable trend.
Join TDS Community!
Get the latest technical analysis and maximize your trading potential by joining TDS Community. This community offers free copy trading services from top traders on MQL5, with no subscription fees and no VPS requirements.
With TDS Community, you can trade safely and confidently. Click below here to join now!
![]()


