

Overview
Gold (XAU/USD) prices have shown varied movements over the past few days, consolidating at specific levels amidst selling and buying pressure. The chart suggests opportunities for both a reversal and trend continuation, depending on the timeframe and technical indicators. This article will analyze price trends on H1, H4, and Daily timeframes, along with trading suggestions based on the latest technical analysis.
XAU/USD H1 Analysis
Trend
On the H1 timeframe, XAU/USD is moving sideways with slight bullish pressure. The price is trading near the 9-SMA, indicating consolidation around the $2,625–$2,627 range.
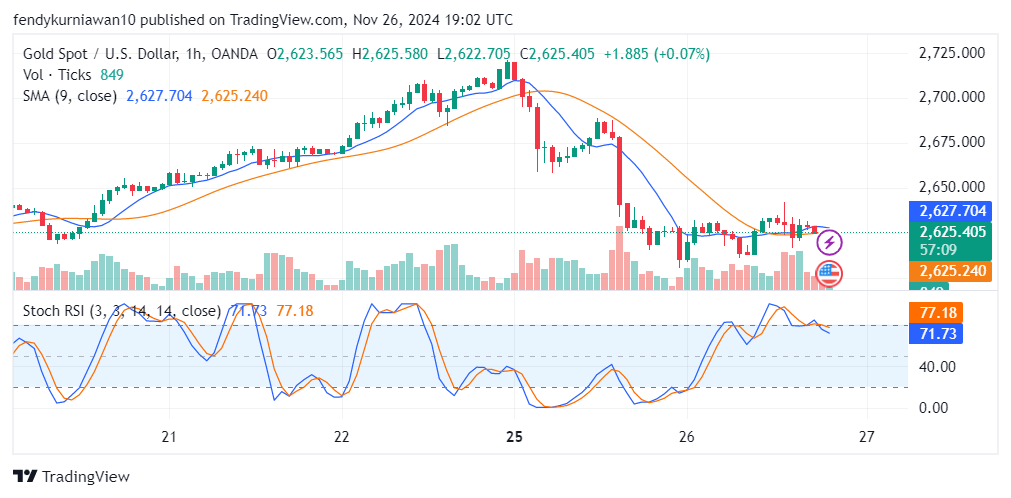
Support and Resistance
- Support: $2,625 – This level serves as a lower boundary in the current price consolidation.
- Resistance: $2,627 – The 9-SMA acts as a dynamic resistance at this timeframe.
Technical Indicators
- Stochastic RSI: The oscillator is in the overbought zone (77.18), suggesting potential short-term selling pressure.
- SMA 9: The SMA line shows the price attempting an upward breakout but lacks confirmation of strong bullish momentum.
XAU/USD H4 Analysis
Trend
On the H4 timeframe, gold prices are still in a downtrend, although the bearish momentum is weakening as the price approaches the 9-SMA. Previous bearish pressure is subsiding, but there is no clear breakout signal yet.
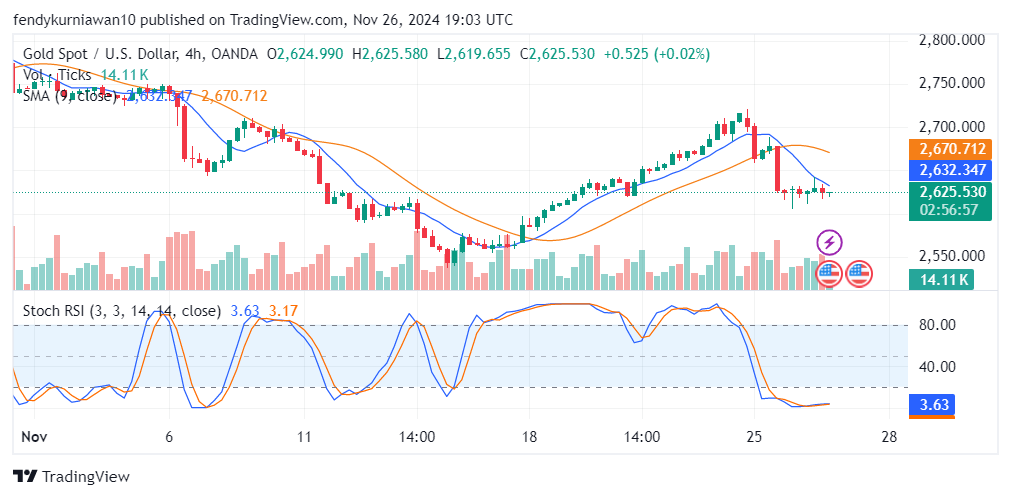
Support and Resistance
- Support: $2,625 – A key level that has been tested multiple times.
- Resistance: $2,670 – The 9-SMA provides dynamic resistance around this level.
Technical Indicators
- Stochastic RSI: Currently in the oversold zone (3.63), signaling a potential rebound toward the nearest resistance.
- Volume: Declining volume indicates that market participants are waiting for new momentum.
XAU/USD Daily Analysis
Trend
On the Daily timeframe, the primary trend remains bearish after the price failed to hold above the 9-SMA at $2,628. However, the downward pressure is starting to show signs of exhaustion.
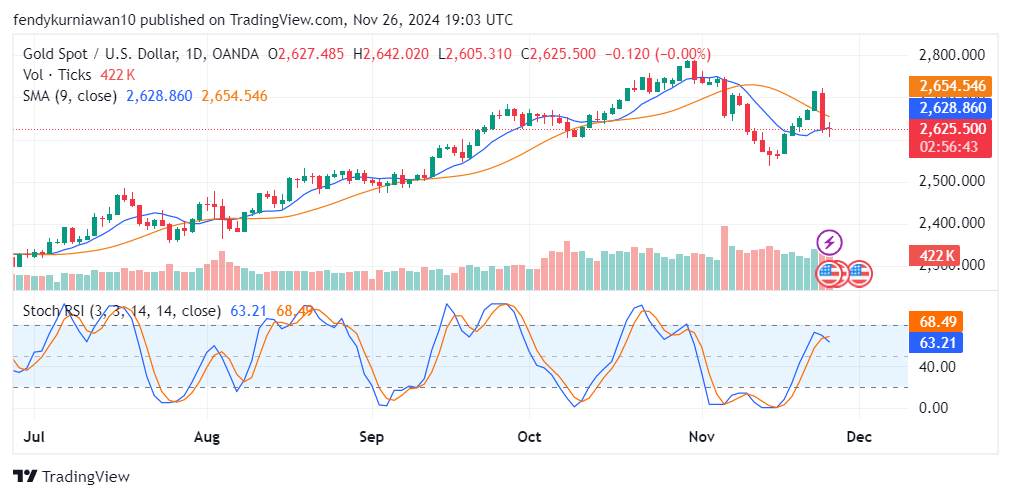
Support and Resistance
- Support: $2,625 – A critical level for further bearish continuation.
- Resistance: $2,654 – The 9-SMA remains a crucial level for potential bullish reversal.
Read: How to identify support and resistance
Technical Indicators
- Stochastic RSI: Positioned in the middle range (63.21), indicating neutral price movement with potential for movement in either direction.
- SMA 9: The price is still below the 9-SMA, signaling bearish dominance despite the weakening momentum.
Price Movement Predictions
- Short-term (H1 and H4): Prices are likely to retest the $2,627 resistance level on H1 or $2,670 on H4. If no strong breakout occurs, the price may weaken back to $2,625.
- Long-term (Daily): If the $2,625 support level breaks, gold may continue its bearish trend toward $2,600. Conversely, if the price breaks above $2,654, it could return to the $2,700 zone.
Trading Suggestions
Option 1: Buy on Resistance Breakout
- Entry Point: $2,628 (Daily resistance breakout)
- Take Profit: $2,654
- Stop Loss: $2,620
- Reason: Potential bullish reversal supported by oversold Stochastic RSI on the H4 timeframe.
Option 2: Sell on Failed Rebound
- Entry Point: $2,627 (Resistance fails to break on H1 and H4)
- Take Profit: $2,615
- Stop Loss: $2,630
- Reason: Dominant bearish trend on higher timeframes with strong resistance pressure.
Join TDS Community Now!
Want to get regular analysis like this? Join the TDS Community, a trading community offering free copy trading with no subscription or VPS fees! We collaborate with selected traders on the MQL5 platform, ensuring you can follow proven trading strategies. Visit tdscopytrade.com for more details and trade safely with a professional community.
Join us now and achieve consistent profits with TDS Community!
![]()


