

As December unfolds, the gold (XAU/USD) market faces a critical juncture influenced by technical patterns and global economic factors. The market has shown mixed signals, combining consolidation with potential breakout opportunities. This article delves into XAU/USD’s technical movements across different timeframes, offering trading recommendations and strategies tailored for this month.
XAU/USD Technical Analysis
4-Hour Chart Analysis
Trend
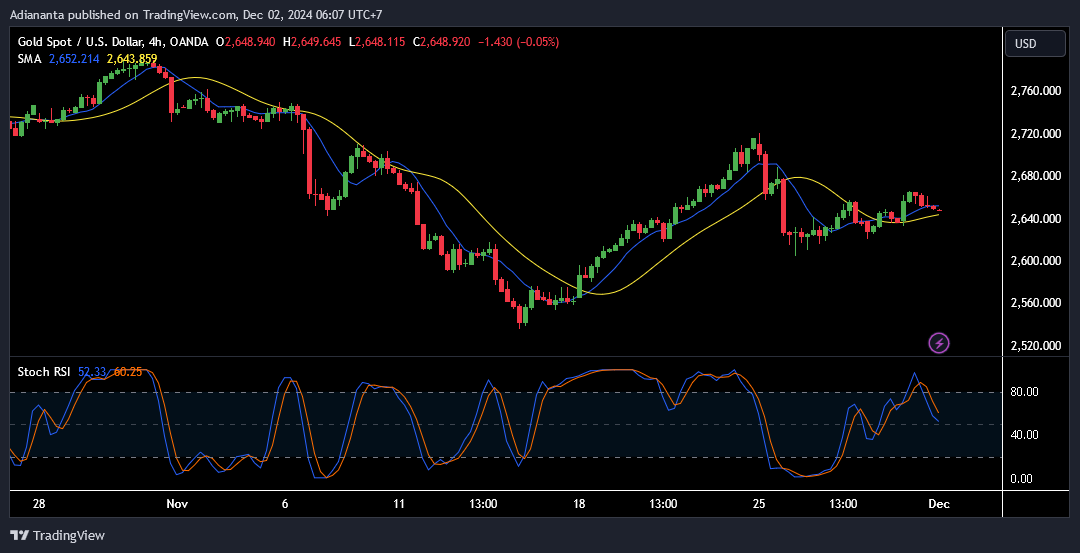
- The 4-hour chart displays a short-term consolidation phase following a sharp bullish rally in late November.
- Gold is hovering around the $2,648.92 mark, with the SMA (Simple Moving Average) suggesting indecision.
- The short-term SMA (yellow line) and medium-term SMA (blue line) are converging near the price, indicating potential sideways movement.
Support and Resistance
- Immediate Support: $2,640 (psychological and recent bounce area).
- Key Resistance: $2,680 (upper range limit).
Indicators
- The Stochastic RSI is at 52, heading down from the overbought region, signaling reduced buying momentum.
- The decreasing slope of the RSI suggests the possibility of a minor retracement before attempting a breakout.
Daily Chart Analysis
Trend
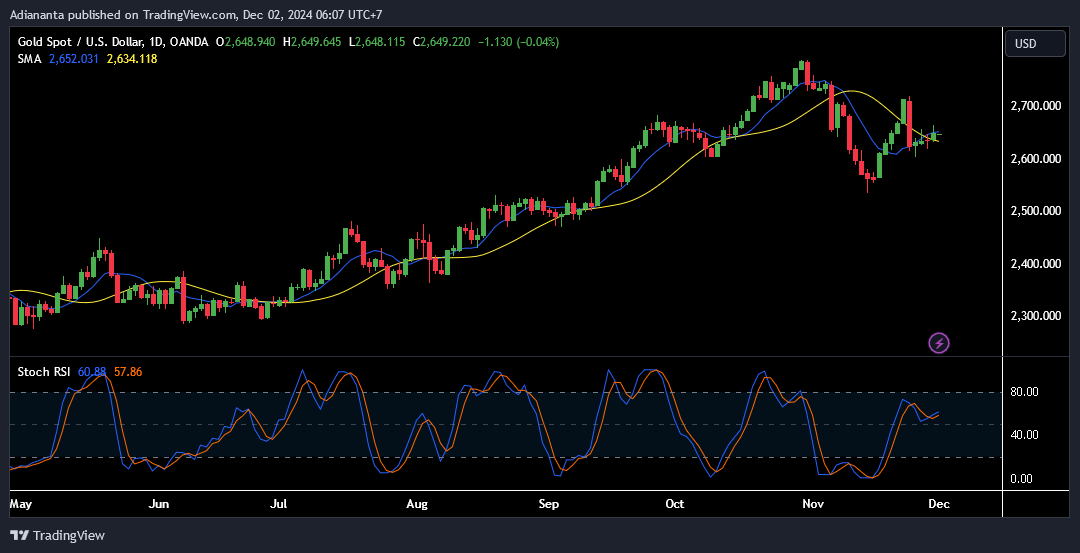
- The daily chart reveals a gradual recovery from the November dip, transitioning into a modest uptrend.
- The price is above the short-term SMA ($2,634.11), suggesting bullish control, albeit with weakening momentum.
Support and Resistance
- Support Levels: $2,630 (key daily pivot), $2,600 (major support zone).
- Resistance Levels: $2,700 (key psychological barrier), $2,720 (next breakout target).
Indicators
- The Stochastic RSI stands at 60, reflecting moderate bullish sentiment but nearing overbought conditions.
- Gold is trading near its 50-day SMA, signaling equilibrium between buyers and sellers.
Weekly Chart Analysis
Trend
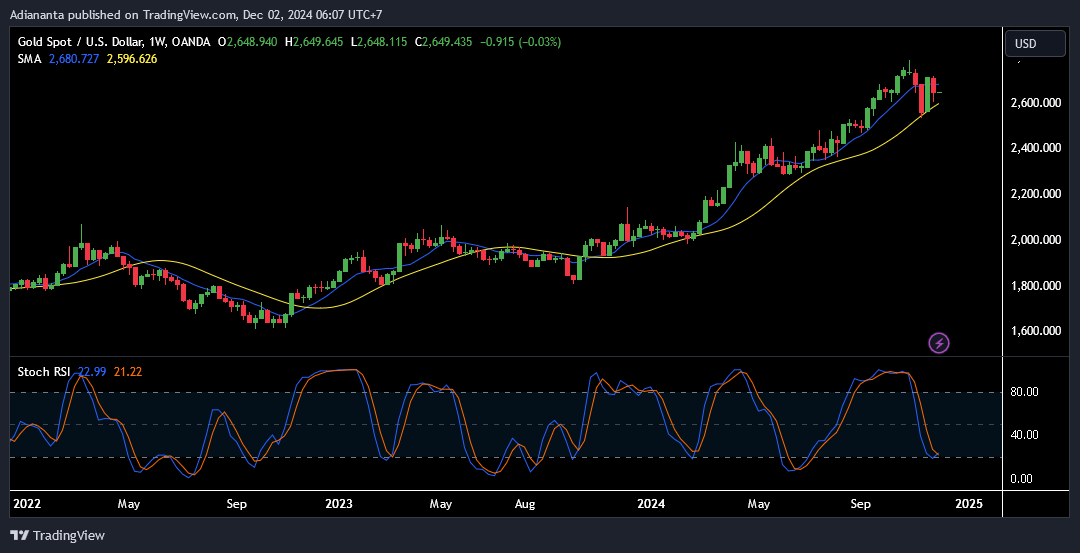
- The weekly chart highlights a strong uptrend that began in mid-2023, with gold reaching new highs above $2,600.
- However, the recent red candlestick suggests profit-taking, potentially forming a retracement to $2,600 or lower before resuming the uptrend.
Support and Resistance
- Support Levels: $2,580 (trendline support), $2,520 (mid-term support).
- Resistance Levels: $2,700 (short-term), $2,760 (longer-term peak).
Indicators
- The Stochastic RSI is at 22, showing oversold conditions and indicating a possible rebound in the coming weeks.
- Price remains well above the 200-week SMA, reinforcing long-term bullish sentiment.
Monthly Chart Analysis
Trend
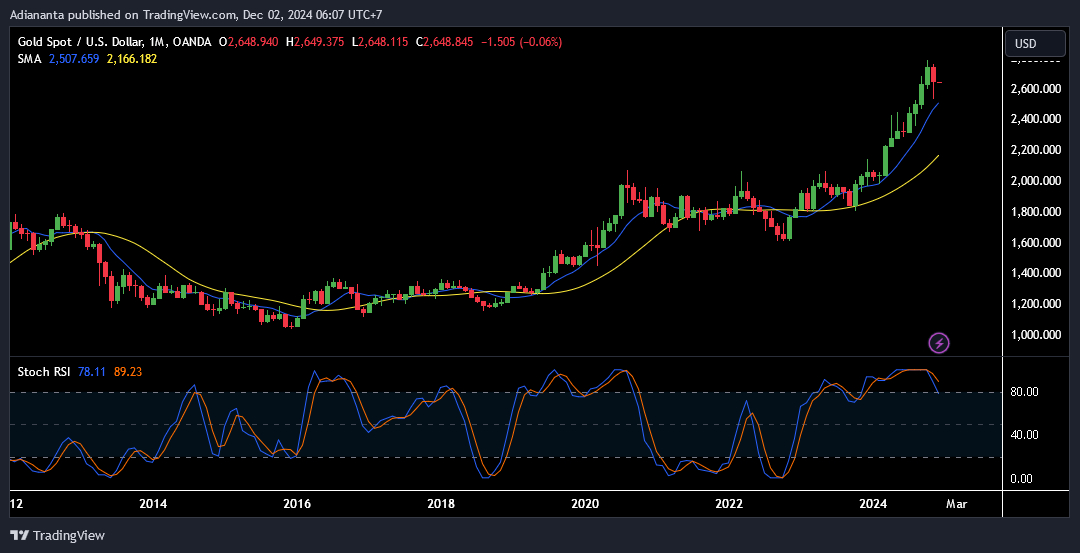
- The monthly chart showcases an uninterrupted bull run since late 2022.
- While gold reached an all-time high near $2,700 in November, the slight retracement in December signals healthy profit-taking rather than a reversal.
Support and Resistance
- Key Support: $2,500 (major long-term support).
- Resistance: $2,760 (recent high), $3,000 (long-term psychological barrier).
Indicators
- The Stochastic RSI at 78 points to extended overbought conditions, suggesting a potential cooling-off period before another leg higher.
- Gold remains firmly above the 100-month SMA, further supporting the bullish macro trend.
December 2024 Trading Predictions
Short-Term Prediction (This Week)
- XAU/USD is likely to consolidate between $2,640 and $2,680 before attempting a breakout.
- If the price sustains above $2,680, it could aim for $2,700.
Mid-Term Prediction (December)
- Gold may revisit support at $2,600 before resuming its upward trajectory.
- A breakout above $2,700 could push prices towards $2,720 or higher by year-end.
Long-Term Prediction
- The overarching bullish trend remains intact, with potential to test $3,000 by mid-2025, driven by macroeconomic conditions such as potential Federal Reserve rate cuts.
Read: How to identify support and resistance
Trading Advice for December 2024
Recommended Trades
- Buy Position:
- Entry Point: $2,640 (current support level).
- Take Profit (TP): $2,680 (short-term resistance) or $2,700 (mid-term target).
- Stop Loss (SL): $2,620 (below immediate support).
- Sell Position (for retracement trades):
- Entry Point: $2,680 (key resistance).
- Take Profit (TP): $2,640 (lower support).
- Stop Loss (SL): $2,700 (breakout point).
Key Trading Tips for December
- Monitor Stochastic RSI for confirmation of momentum shifts.
- Watch for breakout opportunities above $2,680 to target $2,700 or beyond.
- Pay close attention to macroeconomic data, especially U.S. inflation and Federal Reserve updates, which heavily influence gold prices.
Join the TDS Community
This December, XAU/USD offers compelling opportunities for both short-term scalping and long-term investment. Stay disciplined, manage your risks, and let the charts guide your trades.
Maximize your trading success by joining the TDS Community, a thriving network of traders. Enjoy free copy trading from top MQL5 traders without subscription fees or VPS rental costs. Whether you’re a beginner or a seasoned trader, TDS provides the tools and expertise to trade securely and profitably.
![]()


