

Gold (XAU/USD) is showing mixed signals across different timeframes, reflecting uncertainty in the global financial markets. Even the long-term trend remains bullish, short-term charts show price consolidation within a narrow range. In this analysis, we evaluate the Hourly (H1), Four-Hourly (H4), and Daily charts to identify key trends, support and resistance levels, and trading opportunities. Using indicators like the Simple Moving Average (SMA) and Stochastic RSI, we provide actionable insights to help traders make informed decisions.
XAU/USD Hourly (H1) Analysis
Trend
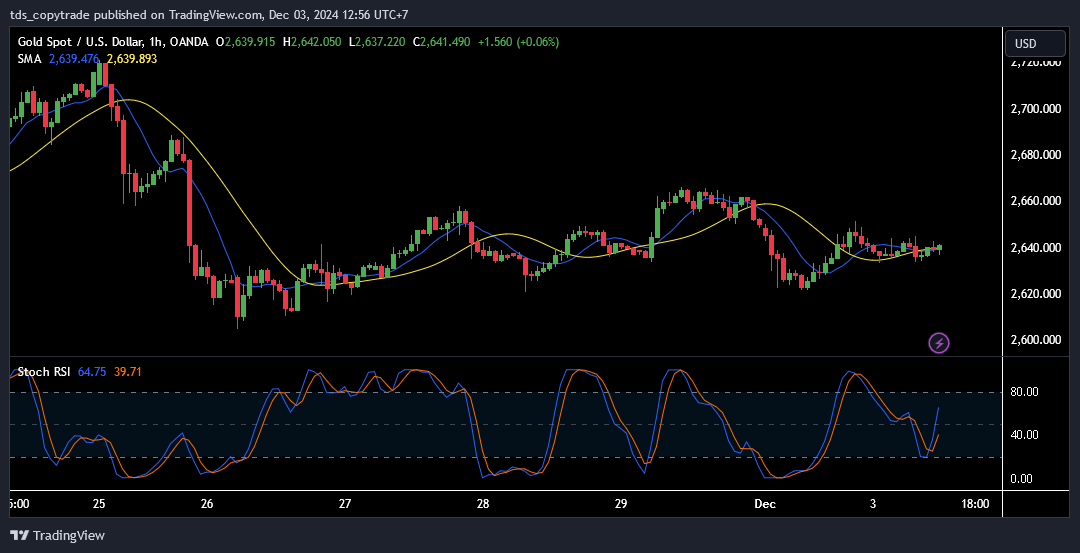
The H1 chart displays a sideways trend. The price has been fluctuating within a tight range of $2,637 to $2,645, indicating a lack of strong momentum in either direction. This reflects market indecision at the current level.
Support and Resistance
- Support Levels:
- Crucial support: $2,637, where the buyers have defended against further decline.
- Resistance Levels:
- Immediate resistance: $2,645, capping the upside.
Technical Indicators
SMA
- The 20-period SMA is currently flat at $2,639, signifying a lack of directional bias.
Stochastic RSI
- The Stochastic RSI is 64.75, recovering from oversold conditions. This suggests the possibility of a short-term bullish move.
XAU/USD Four-Hourly (H4) Analysis
Trend
The H4 chart shows a neutral to bearish trend, with the price forming lower highs and lower lows over the past two weeks. However, recent price action shows signs of stabilization.

Support and Resistance
- Support Levels:
- $2,634, where buyers have consistently entered the market.
- Resistance Levels:
- $2,645, coinciding with the SMA-20. A break above this level could shift momentum upward.
Technical Indicators
SMA
- The SMA-20 is acting as dynamic resistance at $2,645, slightly above the current price.
Stochastic RSI
- At 43.57, the oscillator is in the lower range, indicating limited bearish momentum and potential for upside in the short term.
XAU/USD Daily Analysis
Trend
The daily chart depicts a long-term bullish trend. After reaching a high near $2,700, the price has pulled back and is now consolidating, maintaining its position above key support levels.

Support and Resistance
- Support Levels:
- $2,632, it’s a critical level supported by both price action and the 20-day SMA.
- Resistance Levels:
- $2,650, marking the first barrier for bullish continuation.
- A breakout above $2,650 could open the path to $2,680.
Technical Indicators
SMA
- The 20-day SMA and 50-day SMA are bullishly aligned, they reinforcing the long-term uptrend.
Stochastic RSI
- The Stoch RSI is 58.88, showed space for further upward movement, though momentum appears moderate.
Prediction
Short-Term Prediction
- H1 and H4 Analysis: Price is expected to remain within the range of $2,637 to $2,645. A breakout above $2,645 could drive prices toward $2,660.
Long-Term Prediction
- Daily Chart: Gold’s bullish trend remains intact. Prices could test $2,680 in the coming weeks, provided support at $2,632 holds firm.
Read: How to identify support and resistance
Trading Advice
Buy Scenario
- Entry Point: Place a buy order above $2,645, confirming a breakout.
- Take Profit (TP): Target $2,660 and $2,680.
- Stop Loss (SL): Set at $2,630 to minimize risk.
Sell Scenario
- Entry Point: Enter short positions below $2,632, confirming a breakdown.
- Take Profit (TP): Target $2,620.
- Stop Loss (SL): Set at $2,645 to protect against a reversal.
Reasons for Advice
- Consolidation on the H1 and H4 charts suggests low risk for range trades, with strong support at $2,632.
- The Stochastic RSI on all timeframes shows recovery potential, aligning with the broader bullish sentiment on the daily chart.
Join us NOW!
Take your trading to the next level by joining the TDS Community! Access free copy trading from top traders on MQL5, with no subscription fees and no VPS rental charges. Follow experienced traders, secure your investments, and trade confidently with TDS. Start your journey to smarter trading today—join the TDS Community now!
![]()


